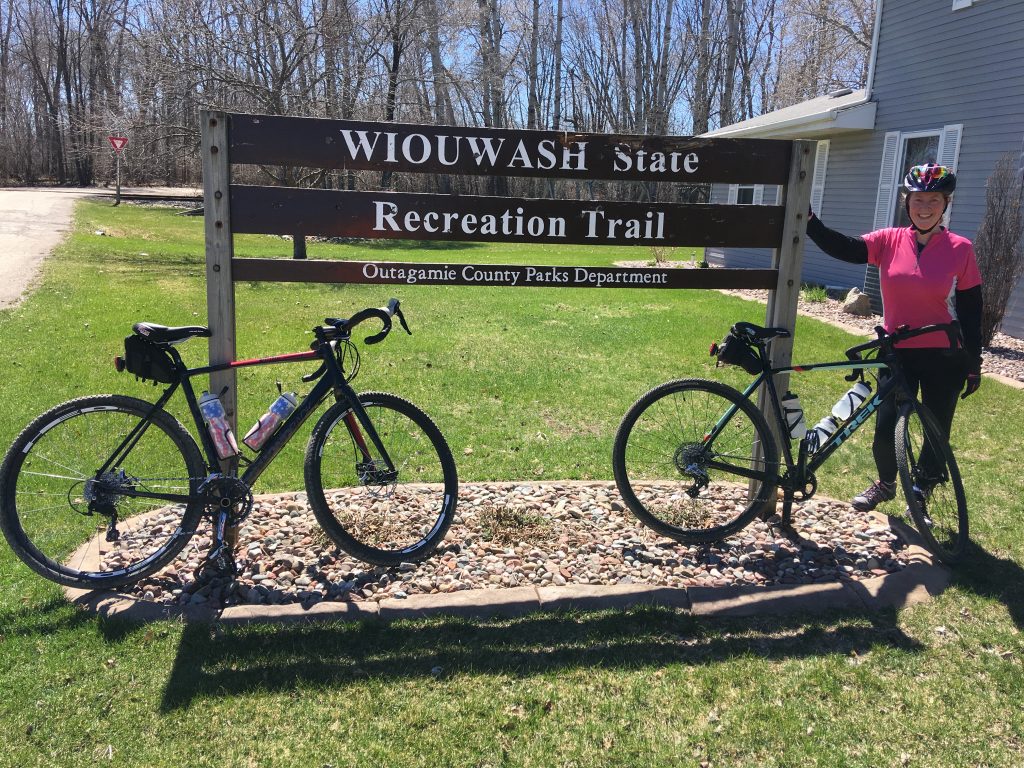
Gravel Biking the Wiouwash Trail starts from the public parking lot on Hwy S near the Bare Bones Brewery round trip to the Outagamie County line.
If you would like to see more Cykelstrom Bicycle Power Meter App videos please visit: @Cykelstrom on YouTube and remember to “Like” and “Subscribe to our channel.
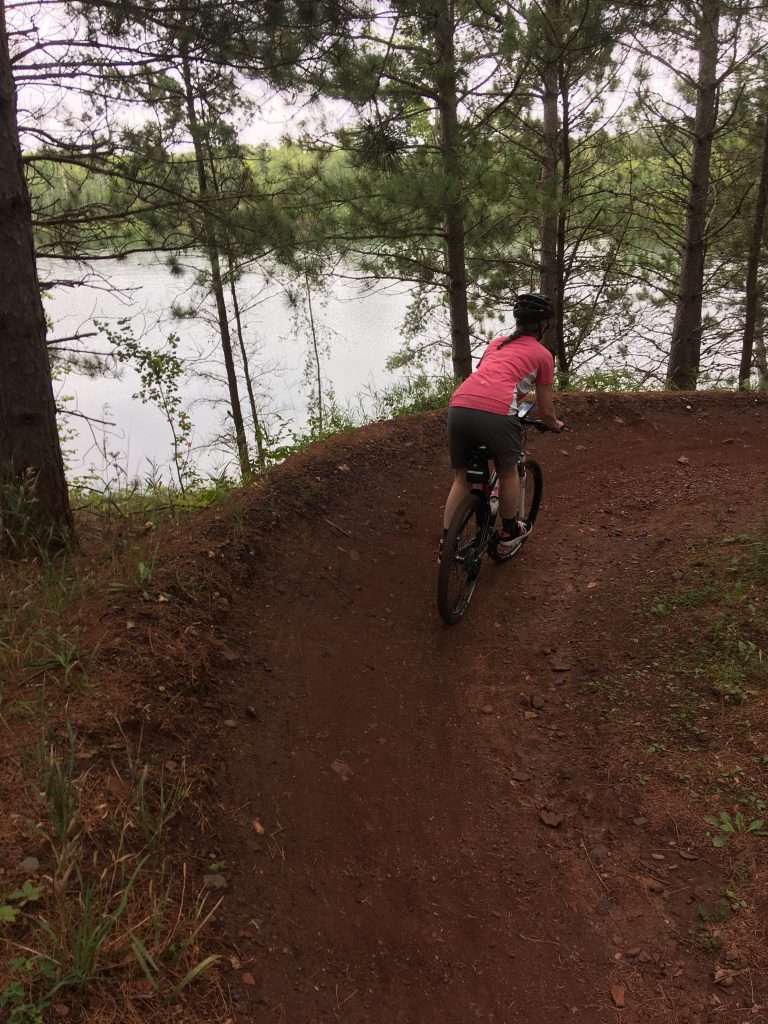
Trail Pic
Gravel Biking The Wiouwash Trail – Cykelstrom Accuracy
| Sensors | Crank Power Meter (Watts avg.) | Cykelstrom (Watts avg.) | Difference (Watts) | Margin of Error (Watts) |
| External Speed and Cadence | 145.51 | 113.42 | -32.09 | +/- 1.26 |
| GPS Speed and External Cadence | 145.51 | 106.89 | -38.62 | +/- 1.22 |
| External Speed Only | 145.96 | 119.17 | -26.79 | +/- 1.44 |
| GPS Speed Only | 145.96 | 111.32 | -34.63 | +/- 1.36 |
Discussion of This Ride’s Results
The result’s from this ride show a bias which is higher than normal. Typically Cykelstrom is within ten percent of the crank power meter when riding gravel. In this case Cykelstrom was within twenty-two percent of the dual sided crank power meter. This may be acceptable for a mountain bike ride in rough terrain, however, I am not happy with this result on a gravel bike riding a rail trail.
So what went wrong?
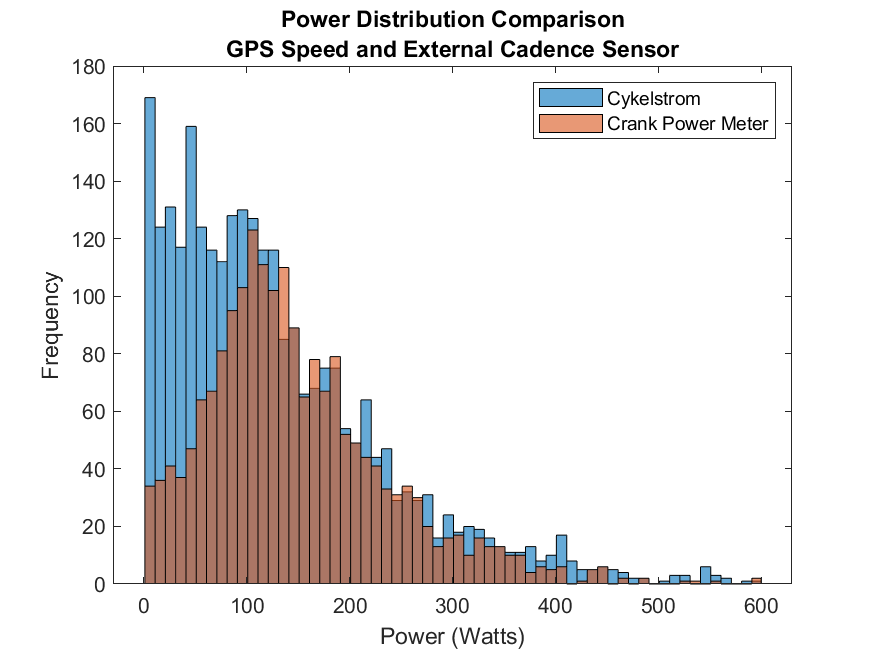
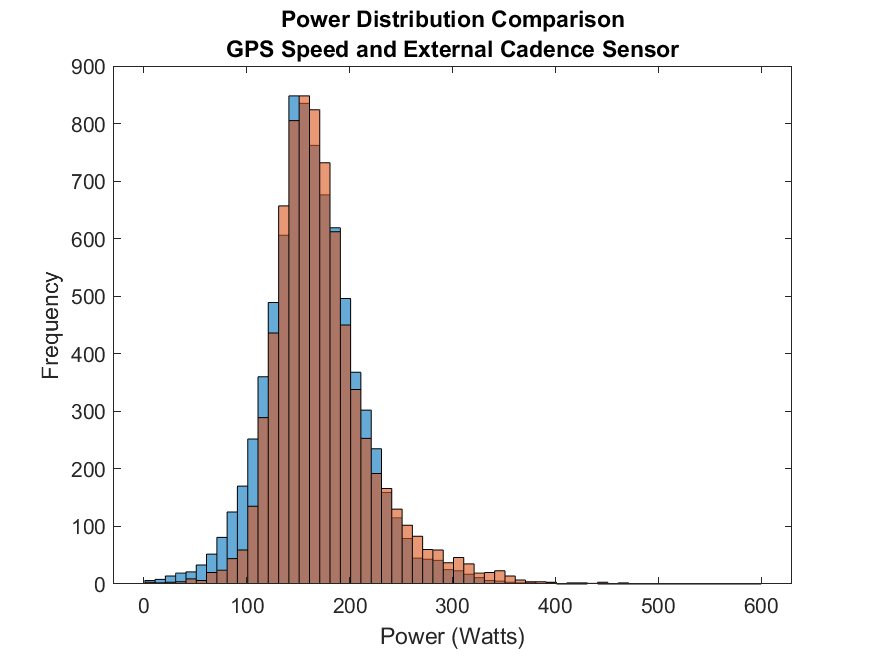
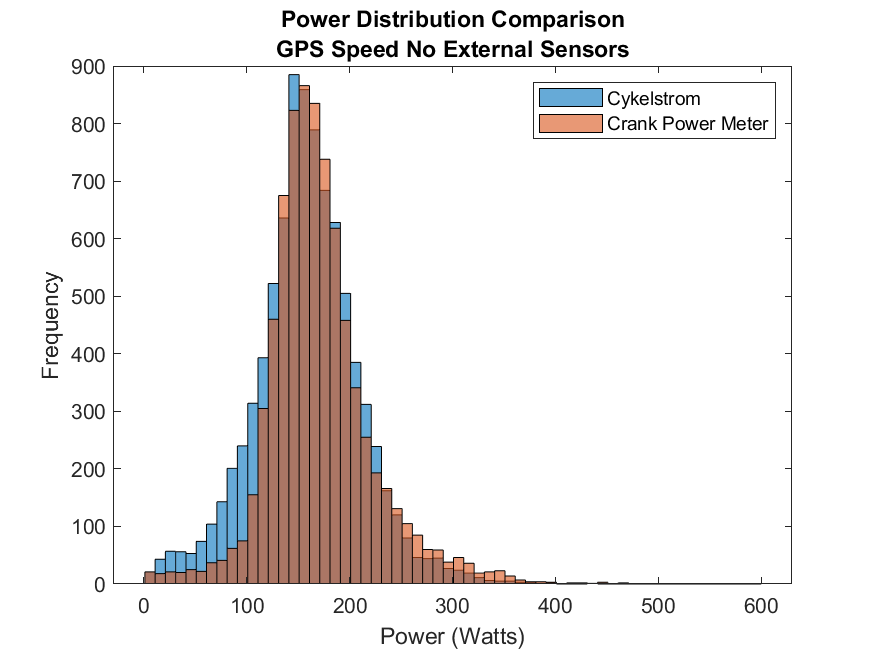
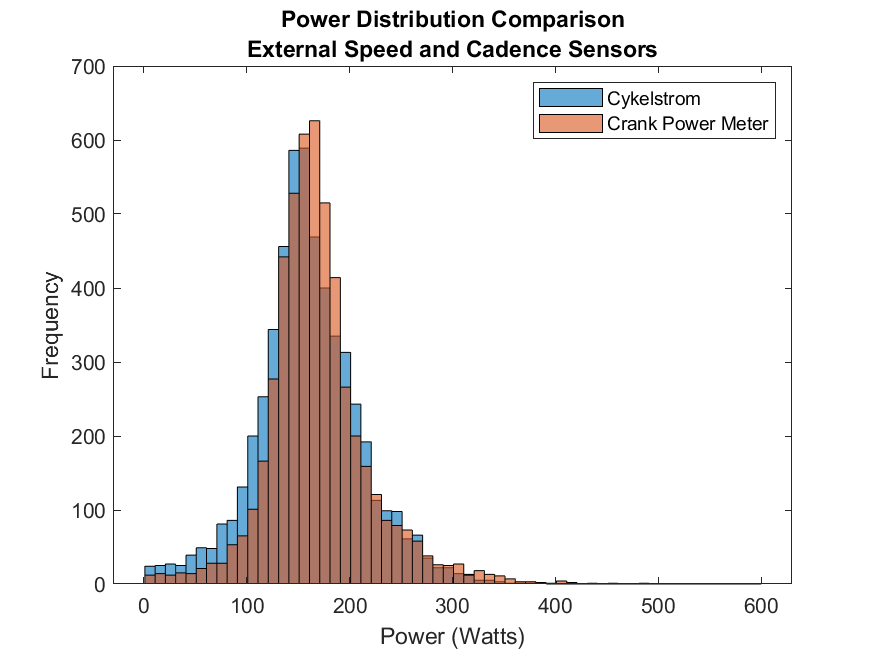
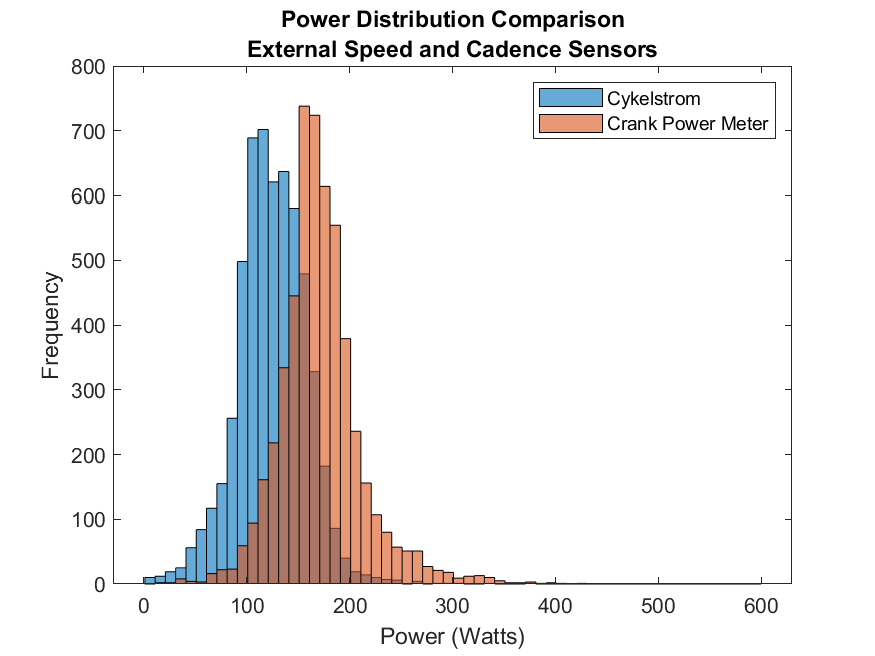
If we take a look at the power distribution curves, we can see that the distributions are very similar in shape, however there is a large offset from the two data sets. In fact the offset is 32 Watts. Cykelstrom recorded data very similarly to the dual sided crank power meter, however, the offset was due to poor calibration of the app. It is very important to calibrate Cykelstrom with the rider sitting on the bike in a normal riding position on a flat and level surface.
Future Improvements
As the developer of the Cykelstrom App, I am always learning ways to make our app better. I am currently working on a new algorithm so our app will become self calibrating. Here is my call to action. If you would like to help participate in new versions of our app, please send me an E-mail and I will be happy to add you to our ride tester’s list. You will be able to shape the way Cykelstrom evolves and become the bicycle computer or power meter app you always wanted. Here is a link for your convenience: developer@cykelstrom.com
Importance of Calibration (The RED Dot)
A factor that is within a rider’s control to get an accurate calculated power estimate is to calibrate Cykelstrom on a flat and level surface before a ride. After you have securely mounted your smartphone on your bike, sit on the seat in your normal riding position and press the “Red Dot” on the face of the Cykelstrom App. You should see the grade percentage reset to near zero or level. Once calibrated, Cykelstrom will remember this initial position until you press the “Red Dot” again. Recalibration is not necessary unless you change the angle of your phone mount or change bikes.
To learn more about calibrating Cykelstrom please read the article “Setting Cykelstrom Up For The First Time.”
Validating Accuracy For Cykelstrom
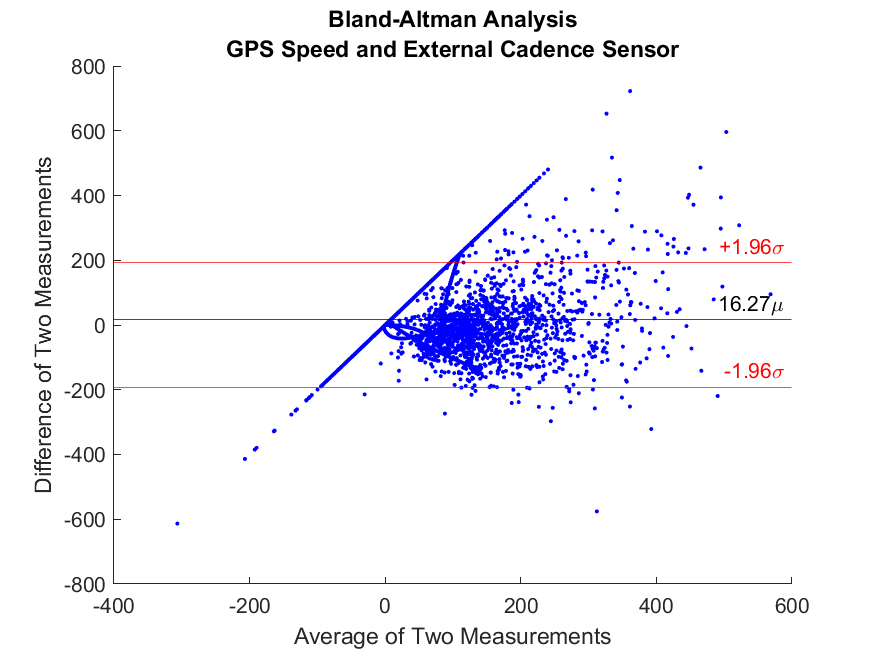
Bland-Altman Analysis is a frequently applied technique to investigate the agreement between two methods of measuring the same thing. In this application we are measuring the instantaneous power of the cyclist using the Cykelstrom Bicycle Power Meter App (blue) and a single sided crank power meter (red) in the figure above.
The distribution of dots in the plot below represent the difference of the two measurement methods versus the average of the two measurement methods. If the dots are evenly distributed above and below the zero line there is no bias between the two measurements. In this ride, there is a 32.09 +/- 1.26 Watt bias. The smaller the bias and margin of error the better the two measurement methods agree with each other. We use Bland-Altman Analysis to validate the accuracy of the Cykelstrom Power Meter App. We are constantly tuning our calculated power estimate to be as accurate as possible across mountain, gravel and road bike designs.
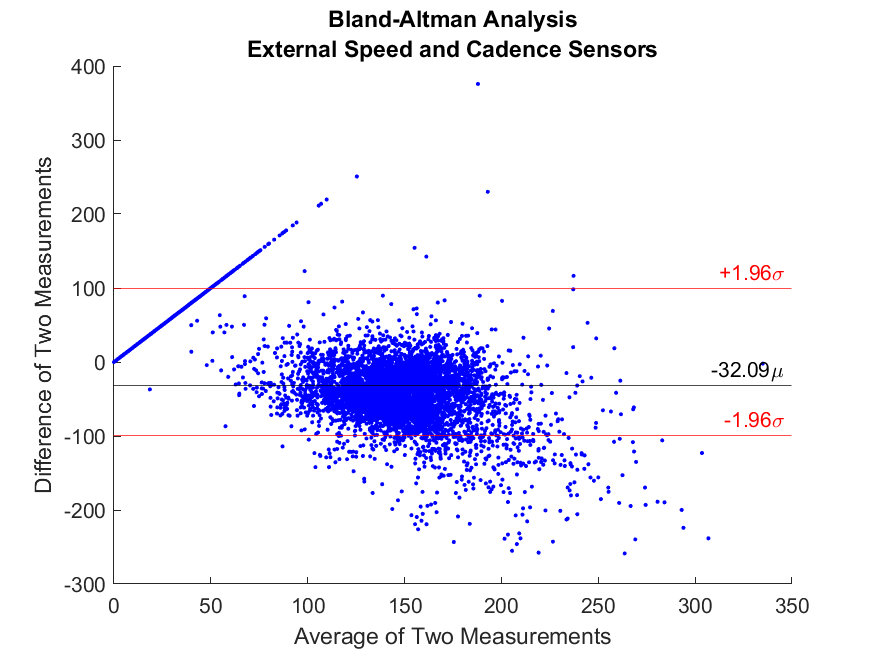
The large bias demonstrated by the Bland-Altman Analysis was due to poor calibration. Properly calibrating the Cykelstrom App on a flat level surface will significantly reduce the large bias of the app compared to a dual sided crank power meter.
Strava Activity For Gravel Biking The Wiouwash Trail
Click on the map to visit this activity in Strava.
| Elapsed Time | Moving Time | Distance | Average Speed | Max Speed | Elevation Gain | Calories Burned |
|---|---|---|---|---|---|---|
|
01:43:21
hours
|
01:41:44
hours
|
25.15
mi.
|
14.84
mph
|
19.28
mph
|
173.56
ft.
|
816
kcal
|
Follow Cykelstrom Test Rides On Strava
The Cykelstrom Bicycle Power Meter App Is Exclusively Available On Google Play