The following discussion compares the Cykelstrom Bicycle Power Meter App, which we will refer to as Cykelstrom and a 4iiii® Precision Pro 105 dual sided crank power meter as the control standard.
Bicycle
The bicycle used is a Diamondback Haanjo, which is a 11-speed gravel/adventure bicycle with drop bars. The rear tire is an American Classic Kimberlite 700C x 40 gravel tubeless tire with a pressure of 45 psi and a circumference of 2200 mm. The front tire was a tubeless Terravail Cannonball 700C x 42 with a pressure of 45 psi. The road surface is asphalt of somewhat marginal quality but typical for paved Midwest rural roads near Oshkosh, Wisconsin.
Smartphone and Sensors
Data was recorded simultaneously using the Cykelstrom Bicycle Power Meter App Version 1.15 on a Motorola G6 Android smartphone running API 26 Oreo. The smartphone used BluetoothSmart® to communicate with the power meter and speed sensor. Cadence reported by the power meter was used in place of an additional cadence sensor, which would have been redundant. The smartphone also recorded heart rate information from a Polar® H6 chest strap heart rate sensor. The external speed sensor is a Wahoo® BluetoothSmart® wireless sensor mounted on the hub of the rear tire.
After the ride was completed, Cykelstrom automatically uploaded its data and created a new activity in Strava® where the Cykelstrom data can be visually analyzed and performance metrics observed. Detailed information about this ride can be observed by going to the Developer’s Strava by clicking on the map below.
| Elapsed Time | Moving Time | Distance | Average Speed | Max Speed | Elevation Gain | Calories Burned |
|---|---|---|---|---|---|---|
|
01:41:58
hours
|
01:34:23
hours
|
23.87
mi.
|
15.17
mph
|
21.39
mph
|
427.17
ft.
|
1,070
kcal
|
Using the ability to record data in a spreadsheet format, data was imported from the Cykelstrom Bicycle Power Meter App to a statistical analysis program. A power distribution chart of both Cykelstrom and the crank type power meter data was created for comparison. Each period in the distribution is 10 watts. The plotting of zero watts, or no power measurement, was excluded from the chart when coasting or being stopped was detected by a cadence value of zero if it was applicable.
External Speed and Cadence Sensors
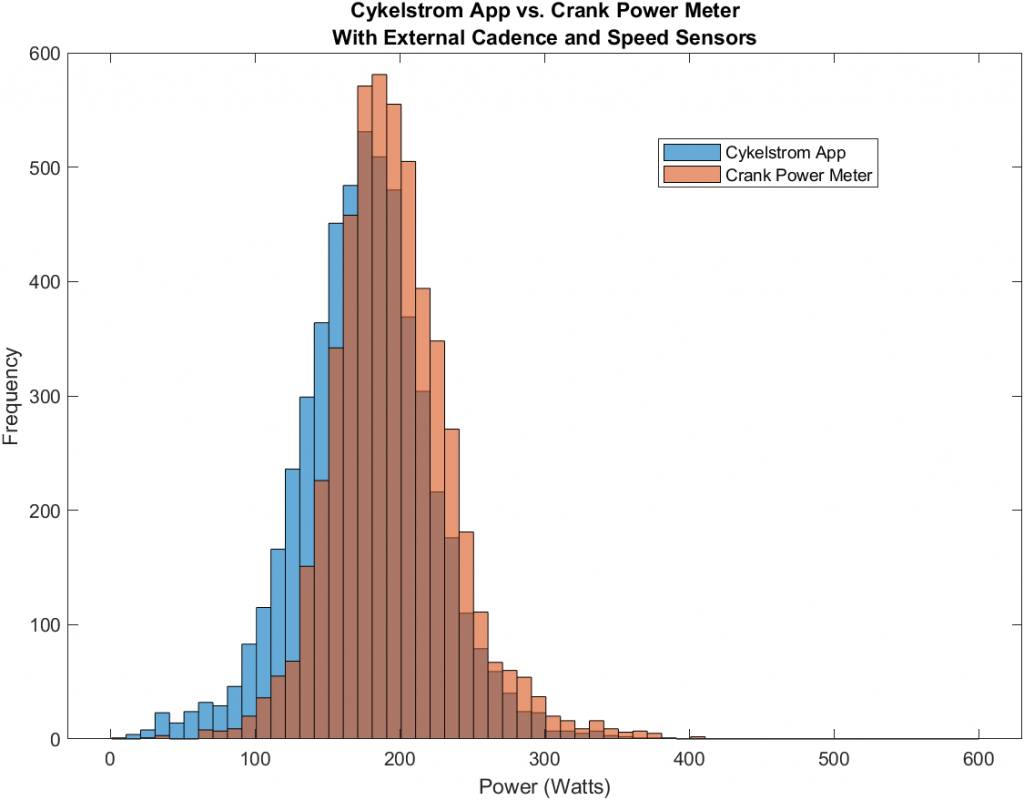
| Cykelstrom | Power Meter | Difference (%) | |
| Average Power | 154.20 | 166.92 | -7.62 |
| Correlation | .8143 | 1 | |
| Standard Deviation | 72.16 | 78.61 |
Cykelstrom used an external speed sensor and cadence information in addition to the motion sensors inside the smartphone to create this power distribution colored in blue. The crank power meter distribution is in red. Although slightly different in shape, you can see that Cykelstrom approximates the crank power meter very closely. The addition of a speed sensor and cadence sensor yields the best correlation and accuracy to the crank power meter standard.
External Speed Sensor
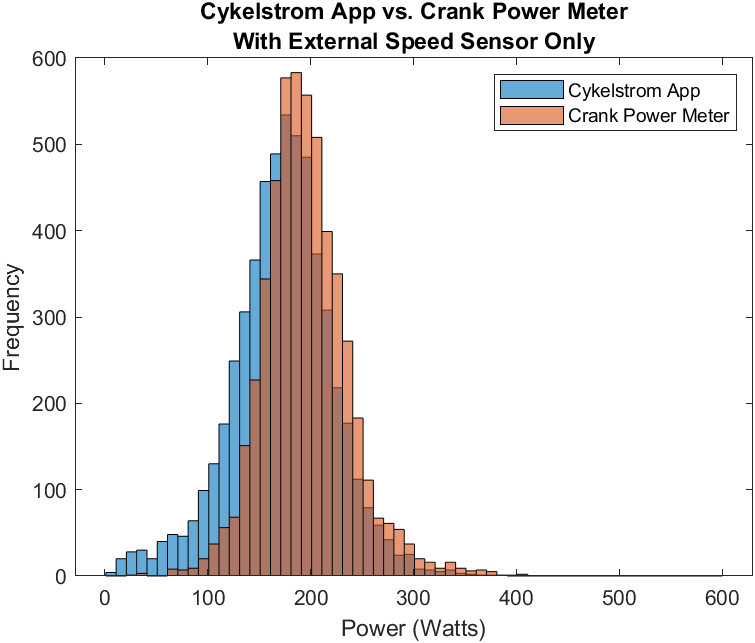
| Cykelstrom | Power Meter | Difference (%) | |
| Average Power | 156.90 | 166.97 | -6.03 |
| Correlation | .7685 | 1 | |
| Standard Deviation | 68.64 | 78.55 |
In this example, the data represents performance while only using an external speed sensor. There is no cadence information. You can see the shape of the distribution remains very similar to the crank type power meter with a decrease in correlation. Overall averages remain very close to the crank type power meter. The 4iiii® Precision Pro power meter claims an accuracy of +/- 1 percent.
GPS For Speed and External Cadence Sensor
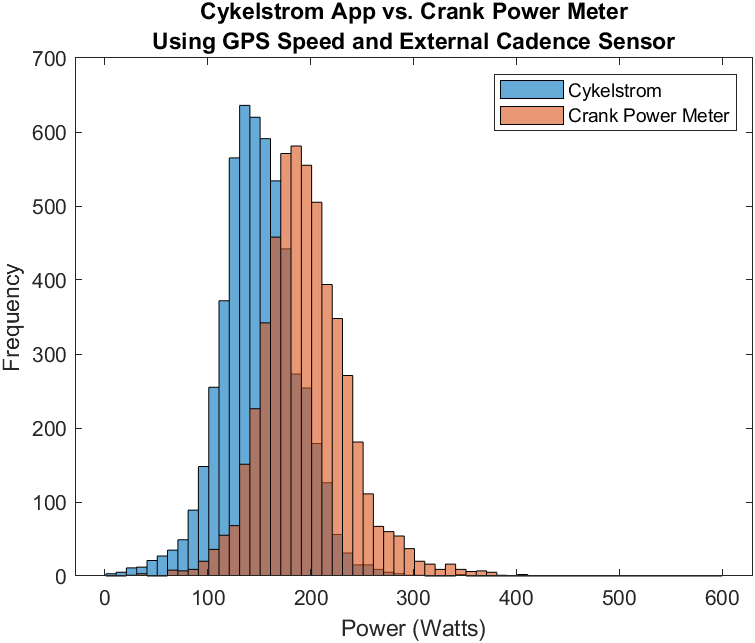
| Cykelstrom | Power Meter | Difference (%) | |
| Average Power | 132.39 | 166.92 | -20.69 |
| Correlation | .7475 | 1 | |
| Standard Deviation | 59.02 | 78.61 |
This example shows what happens when you rely on GPS speed information. The power distribution shapes remain very similar, however there is an offset introduced in the power estimates due to the differences in using GPS for speed vs. an external speed sensor. It is critical that the circumference of the tire that the speed sensor is located is measured precisely. Small errors in this measurement can distort the power estimate. I recommend using a flexible metric tape measure to measure your tire circumference at the tire pressure you prefer. Using GPS with a cadence sensor still gives good correlation, but the accuracy will decrease when compared to using an external speed sensor.
No External Sensors
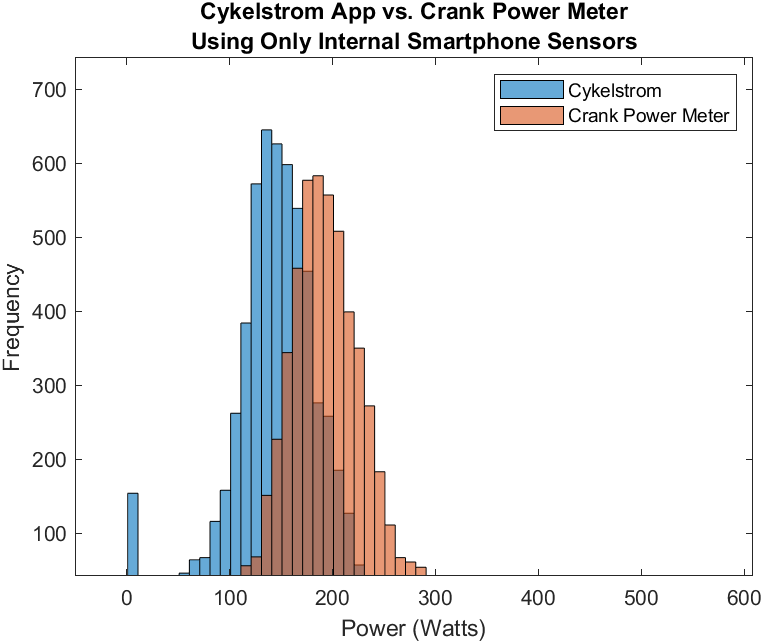
| Cykelstrom | Power Meter | Difference (%) | |
| Average Power | 154.20 | 166.97 | -18.91 |
| Correlation | .6846 | 1 | |
| Standard Deviation | 54.80 | 78.55 |
Cykelstrom provides useful information even when used without any additional sensors. You only need your smartphone. The power distribution shape between Cykelstrom and the power meter are still very similar. There is an offset introduced by using GPS speed information and overall ride averages are consistent. Correlation is lowest when not using any sensors as may be expected.
Time Series Comparison
Comparing the power distribution gives you a good idea that the power information is meeting the standard, however, when your riding you are observing the information in real time. The following charts give you and idea of how well Cykelstrom tracks the crank power meter in real time as you ride.
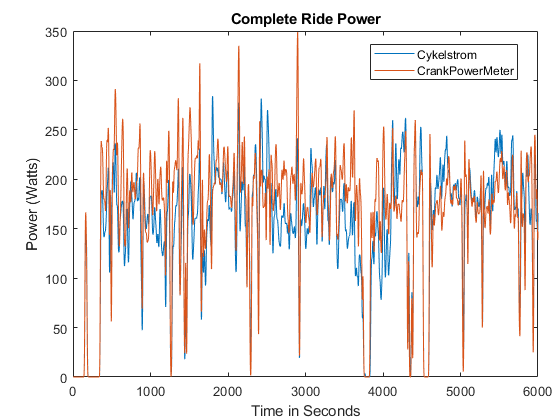
The chart above is displaying the power data for the duration of the entire ride. You can see that power fluctuates considerably when looking at the complete ride. This data is even smoothed on a ten second moving average basis. A better way is to look at the data for a segment of the ride.
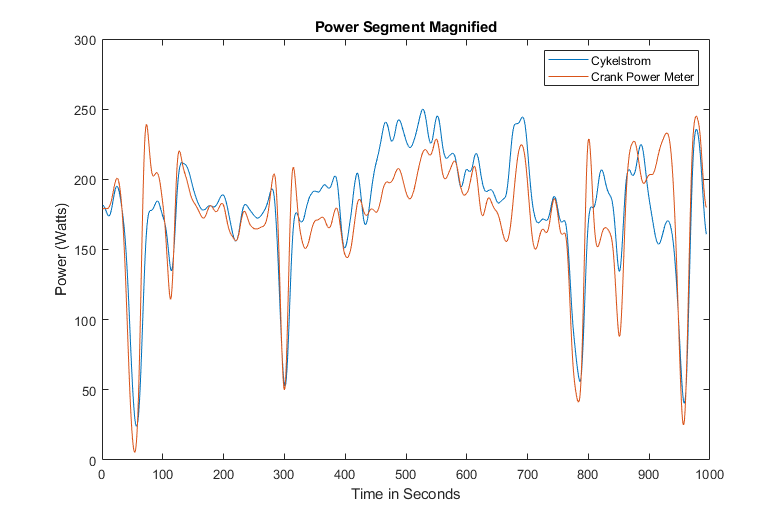
This ride segment is a portion of the data from the previous chart. When observing the data in a segment, it is easier to see that Cykelstrom tracks the crank power meter quite well. Data that tracks well gives higher correlation. This segment is a typical representation of how well Cykelstrom tracks the crank power meter in real time, or in other words, the power number you see while you ride. You have the option to display your average power for 1, 3, 5, 10, and 20 seconds.
Conclusion
The Cykelstrom Bicycle Power Meter App when used correctly can provide power estimates at a small fraction of the expense of crank type power meter. Cykelstrom improves it’s power estimates when combined with external speed and cadence sensors. If you have an external power meter, you can still use it to collect ride data and automatically upload it to Strava.
I hope you enjoyed this post and as always happy riding.
Kind regards,
Chuck