If you are interested in power biking and have a smartphone, you may be interested in observing your power output measured in watts. Smartphones typically have sensors that can be used to measure acceleration. Most smartphones also have a GPS receiver to determine your location and speed. Add some weather information and you have the makings of a power biking app.
Power Biking App Accuracy For This Ride
The best accuracy for this ride is highlighted in bold.
| Sensors | Crank Power Meter (Watts avg.) | Cykelstrom (Watts avg.) | Difference (Watts) | Margin of Error (Watts) |
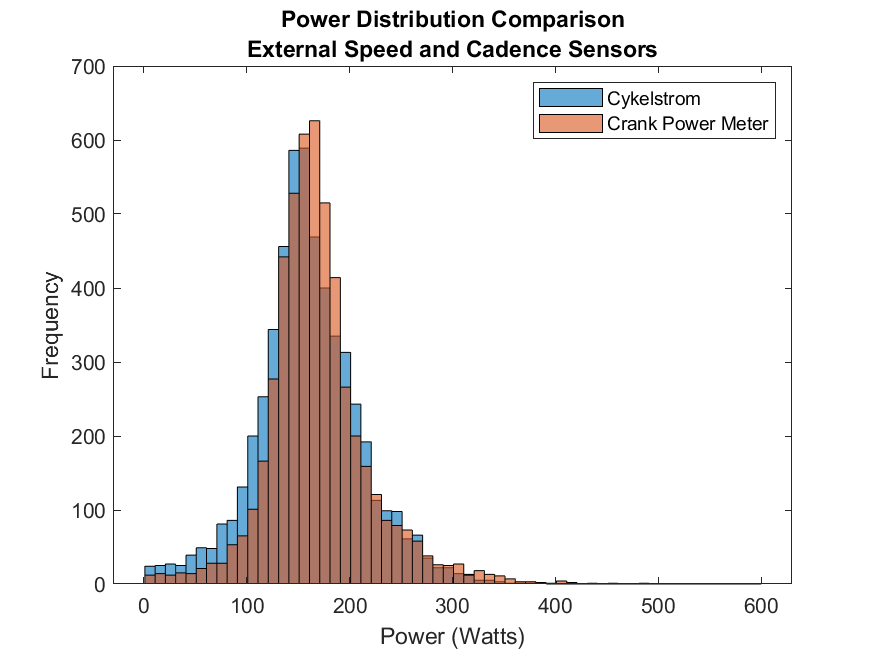
| External Speed and Cadence | 141.84 | 142.38 | 0.53 | +/- 1.44 |
| GPS Speed and External Cadence | 141.84 | 139.71 | – 2.13 | +/- 1.62 |
| External Speed Only | 142.96 | 152.95 | 9.99 | +/- 1.67 |
| GPS Speed Only | 142.96 | 149.16 | 6.21 | +/- 1.41 |
Discussion Of This Ride’s Results
This ride’s most accurate results are when external speed and external cadence sensors are used in conjunction with sensors internal to the smartphone. The smartphone used for this test ride was a Motorola G6 which has the Bosch BMI160 inertial measurement unit or IMU. I purchased this smartphone as a refurbished unit for around fifty dollars. The external cadence and speed sensors were purchased as a pair for around sixty dollars, however, you can find these sensors for a lot less. The cost of a typical power meter is easily five to ten times more expensive. The accuracy of a crank based power meter can be as good as +/- 1%, however, for me I am happy with accuracies +/- 10% and I like being able to move my smartphone to many different bikes.
The following graph is a power distribution that compares the biking power meter app, Cykelstrom, to a dual sided crank based power meter.
For an example of power distributions when riding a mountain bike please read Mountain Biking Hartman Creek State Park.
For a more detailed discussion of the power biking app and comparison to a crank power meter please read Power Distribution Comparison: Cykelstrom Bicycle Power Meter App vs. Crank Power Meter.
Strava Activity
Click on the map to visit this activity in Strava. Feel free to follow all of our test rides of the power biking app.
| Elapsed Time | Moving Time | Distance | Average Speed | Max Speed | Elevation Gain | Calories Burned |
|---|---|---|---|---|---|---|
|
01:42:42
hours
|
01:38:50
hours
|
25.38
mi.
|
15.41
mph
|
24.66
mph
|
448.16
ft.
|
1,037
kcal
|
Follow Cykelstrom Test Rides On Strava
The Cykelstrom Power Biking App Is Only Available On Google Play