Bicycle power meter apps, like Cykelstrom, utilize real-time weather data for accurate calculations. Factors such as wind resistance greatly affect a cyclist’s power estimate. Air density is crucial in determining power needed to overcome wind resistance. Cykelstrom uses current air density providing better power estimates than generic values alone.
If you would like to see more Cykelstrom Bicycle Power Meter App videos, please visit @Cykelstrom on YouTube and remember to “Like” and “Subscribe” to our channel.
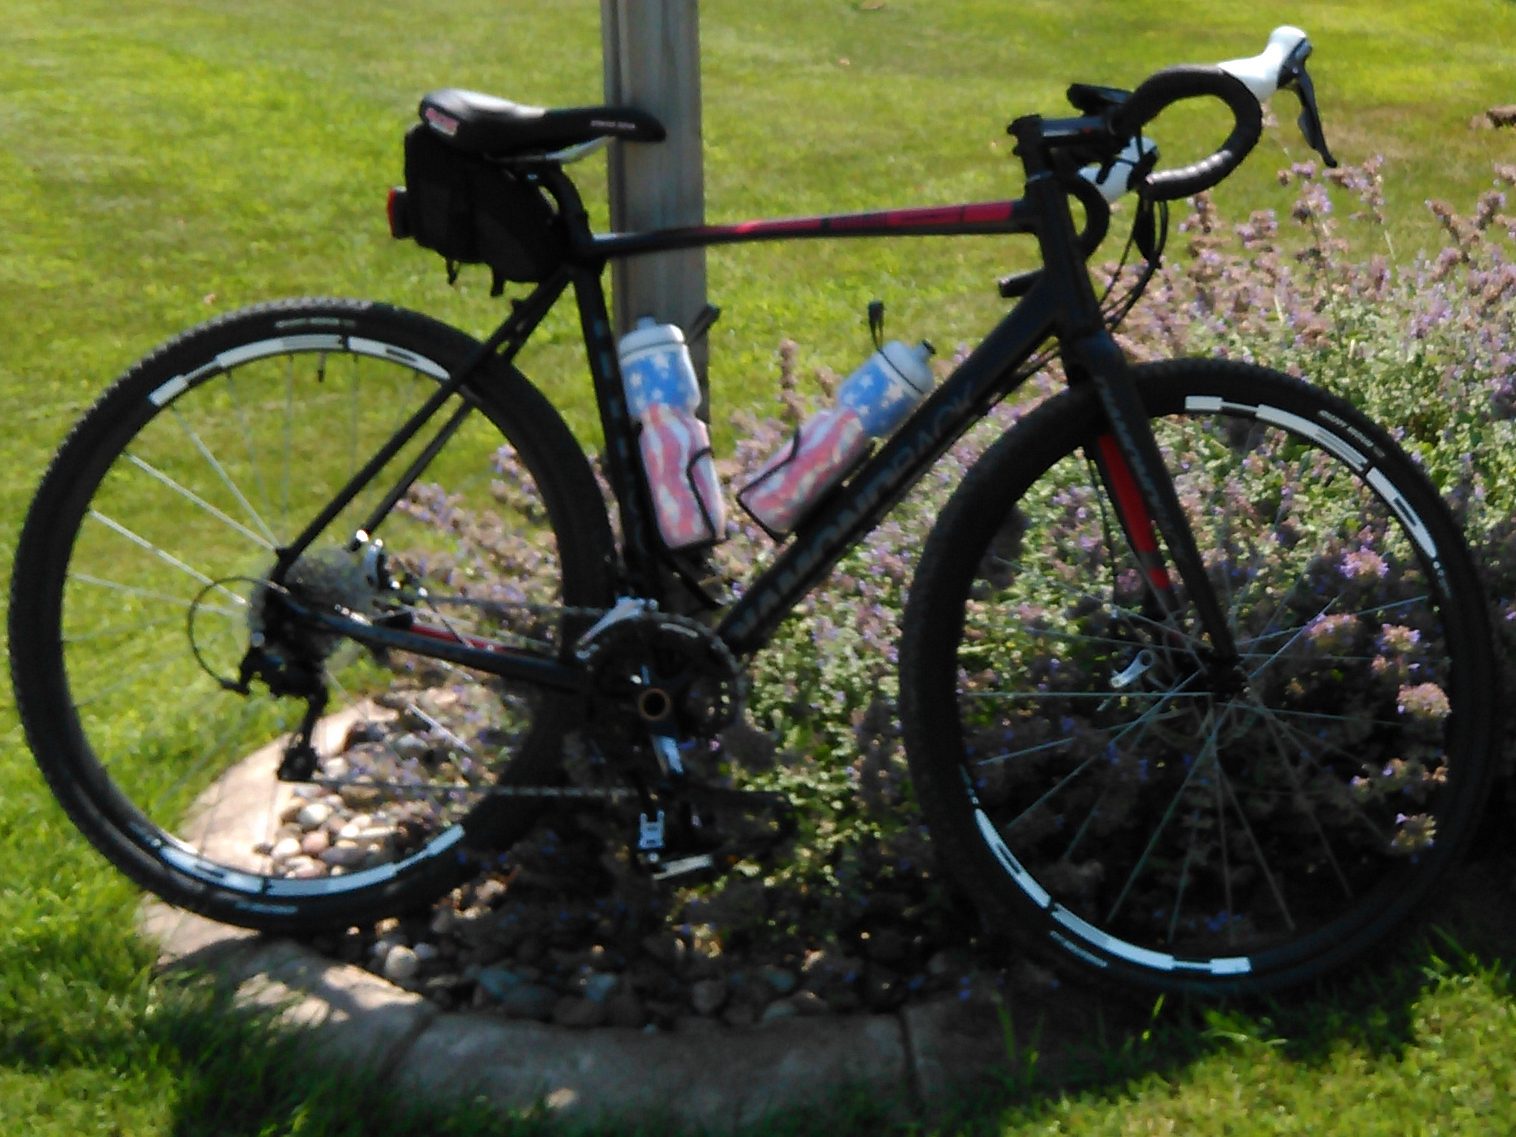
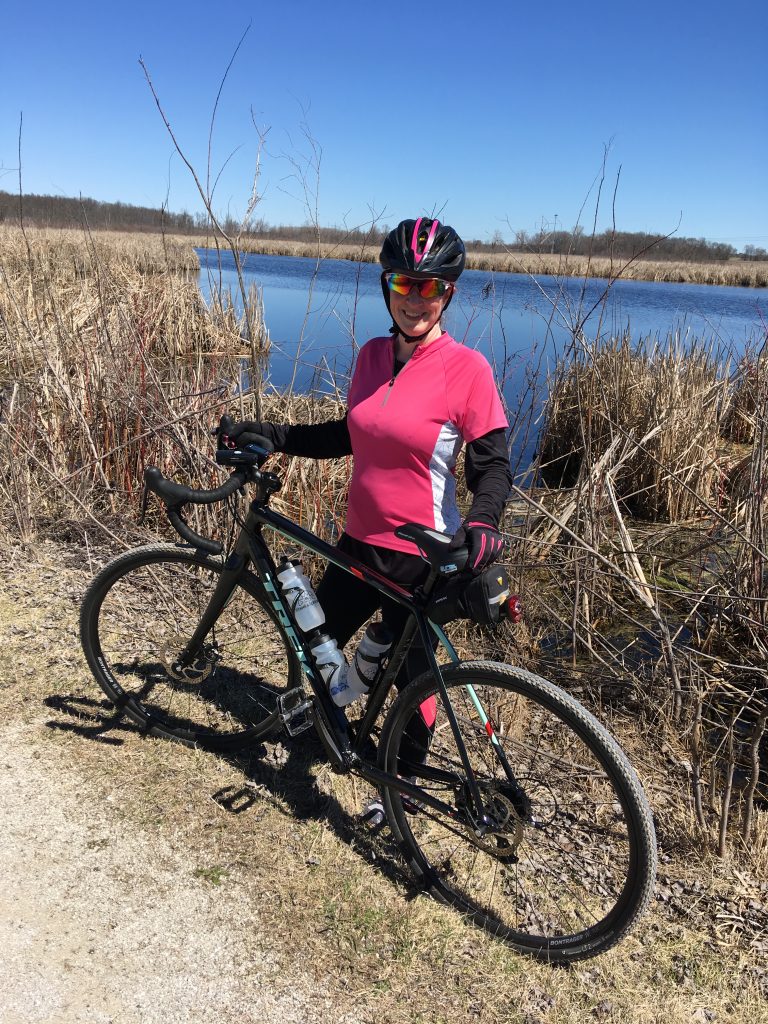
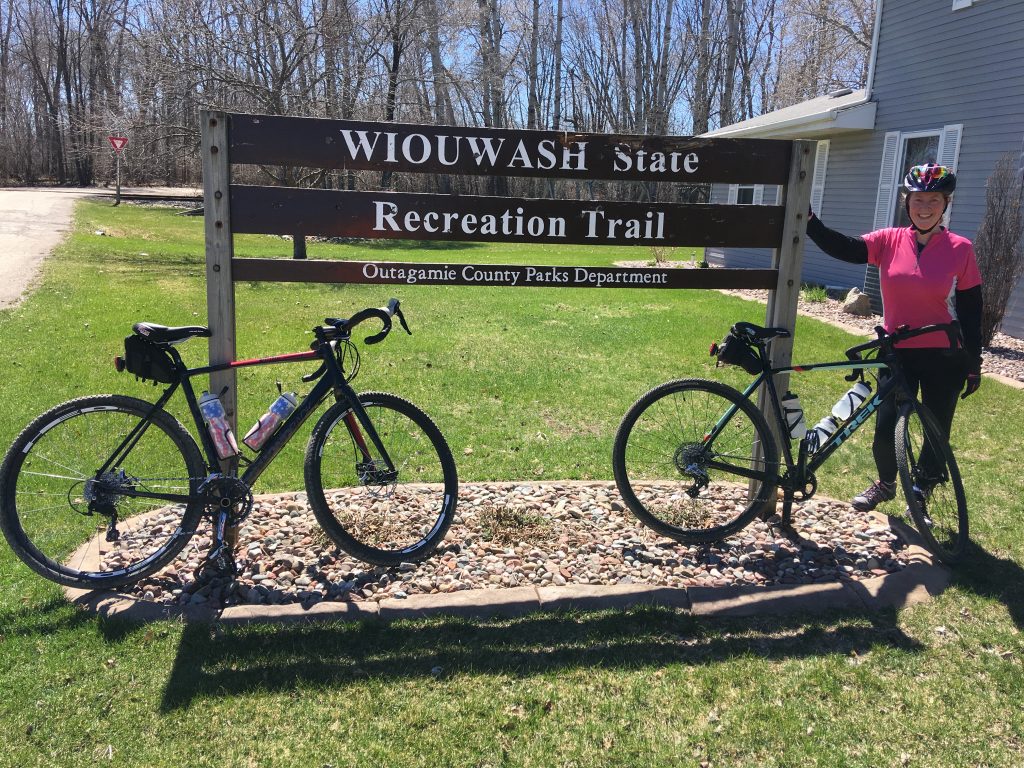
Gravel Bike, Smartphone And Sensors
I rode a Diamondback Haanjo Comp as a gravel bike for this ride equipped with a 4iiii Precision Pro dual sided power meter on a Shimano 105 11-speed group set. The speed sensor was a Wahoo Bluetooth speed sensor and cadence information was provide by the power meter. Heart rate information was collected with a Polar H7 chest strap sensor. The smartphone was a Samsung A21 running Android 12 and Cykelstrom version 1.50. All of the power meter and sensor data was collected, saved locally and automatically uploaded to Strava with the Cykelstrom Bicycle Power Meter App at the end of the ride.
Gravel Bike Power Meter App Accuracy
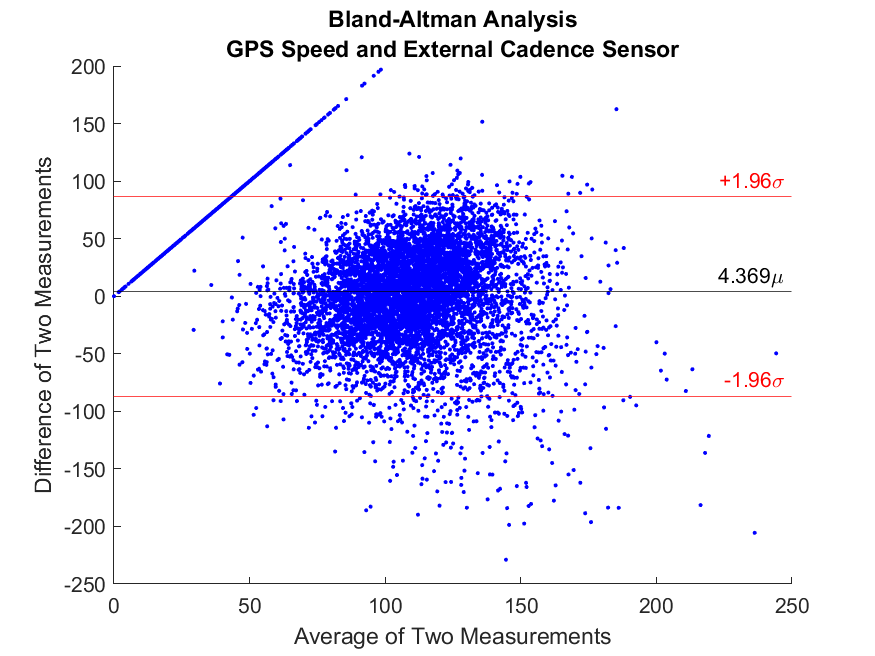
The best accuracy for this ride is emphasized in bold.
| Sensors | Crank Power Meter (Watts avg.) | Cykelstrom (Watts avg.) | Difference (Watts) | Margin of Error (Watts) |
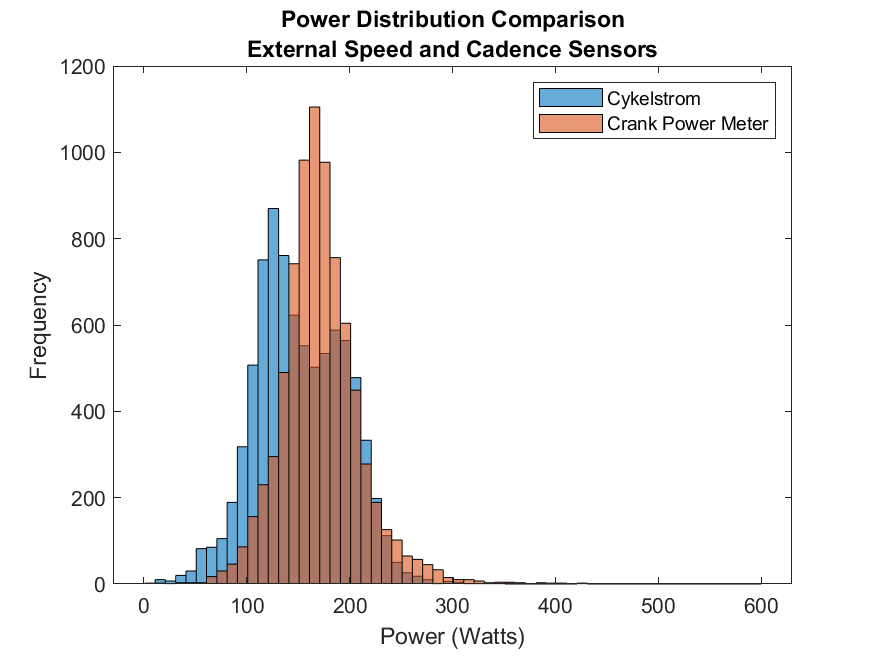
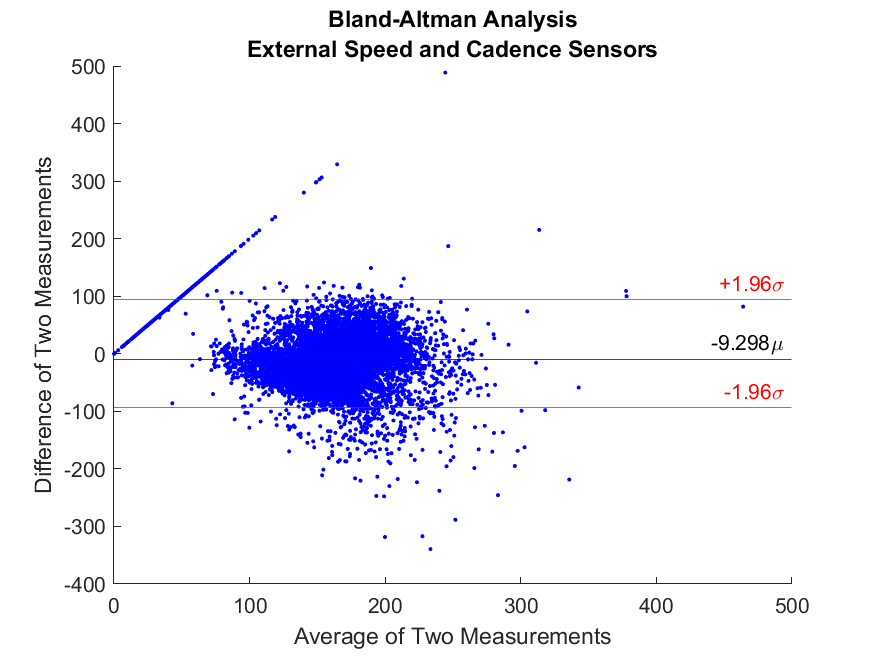
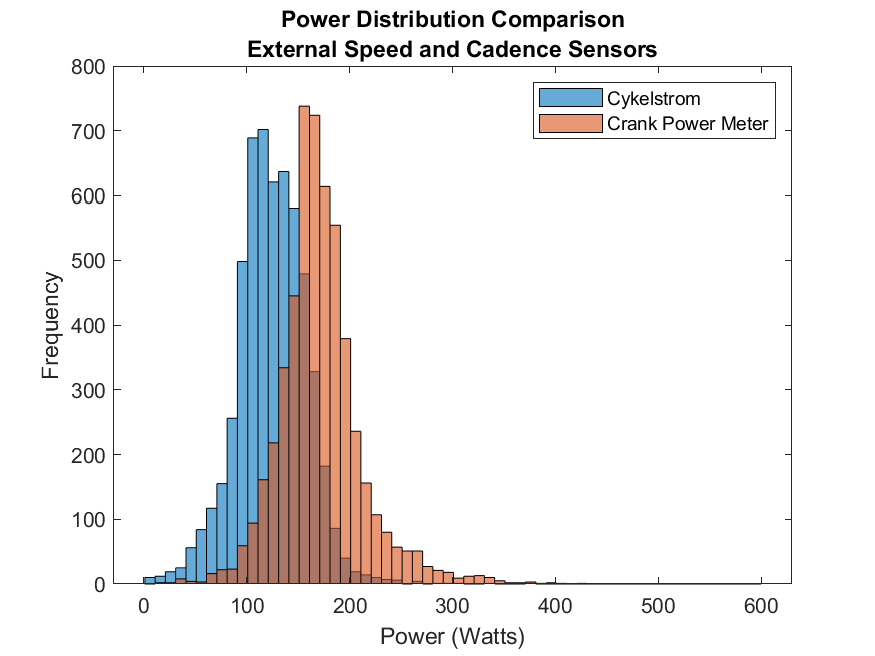
| External Speed and Cadence | 90.71 | 103.40 | +12.68 | +- .9812 |
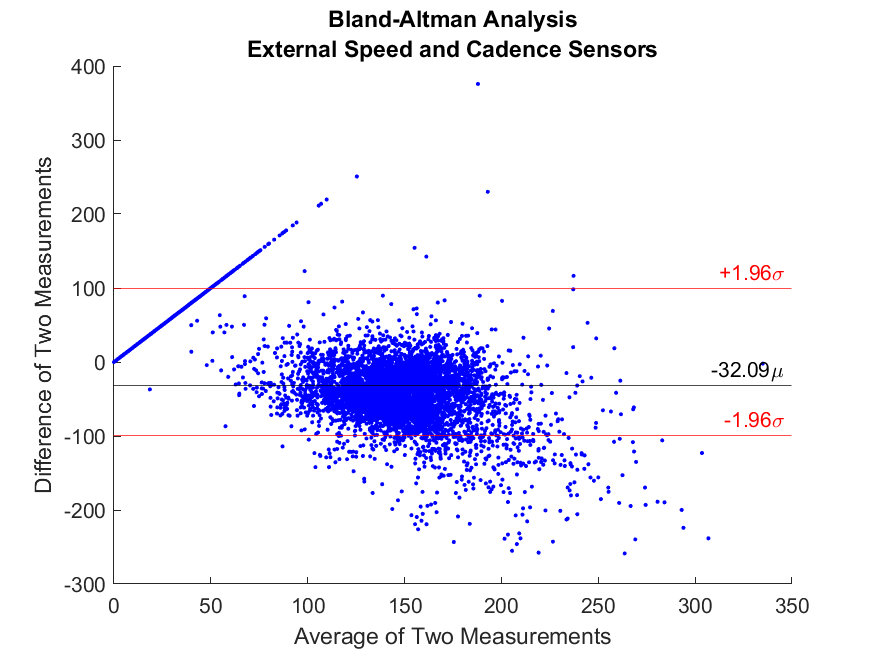
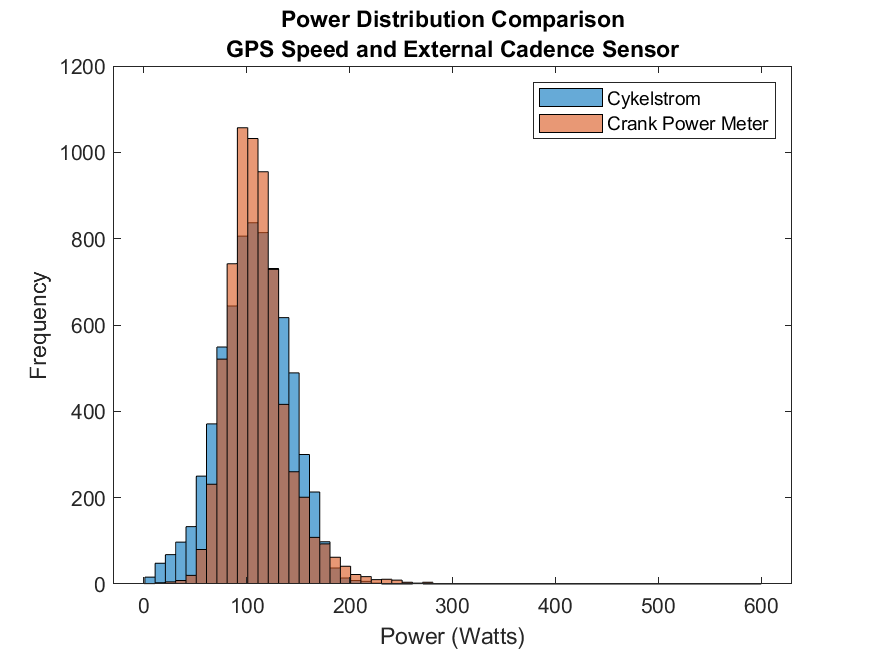
| GPS Speed and External Cadence | 92.63 | 95.08 | +4.37 | +- .9647 |
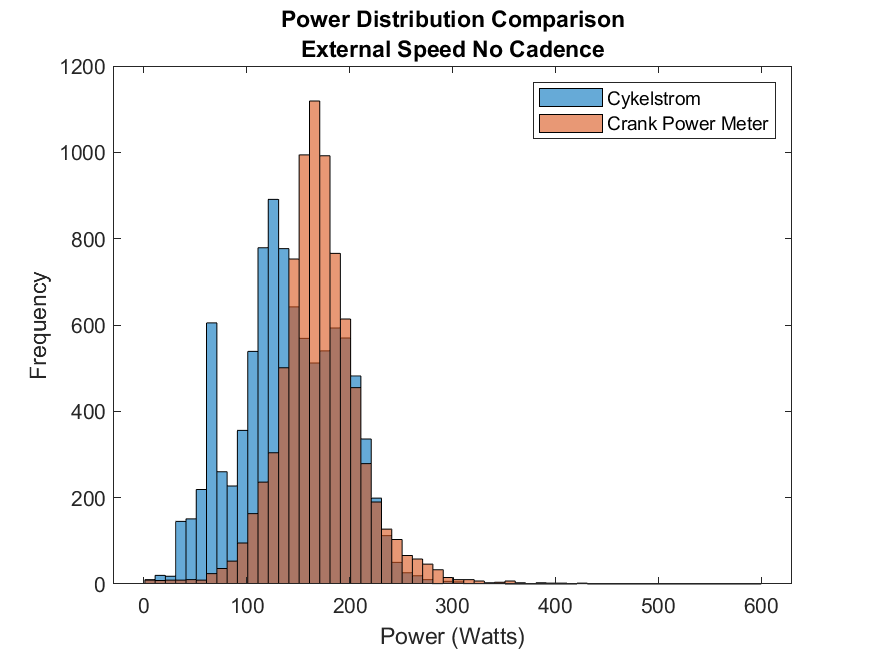
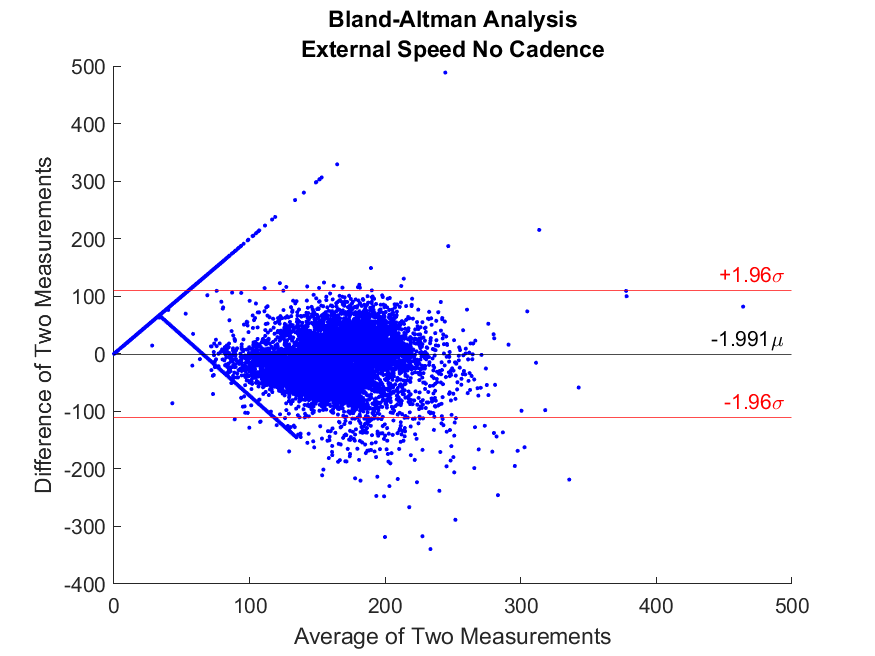
| External Speed Only | 90.71 | 109.33 | +16.70 | +- 1.068 |
| GPS Speed Only (no additional sensors) | 92.63 | 100.18 | +7.55 | +- 1.0625 |
Discussion Of This Ride’s Results
I have emphasized in bold the results from “GPS Speed and External Cadence” as the most accurate. When compared to the dual sided power meter, Cykelstrom had a small bias of 4.369 +/- .9647 Watts which is an average difference of about 5% for the best case scenario. The worst case scenario shows a bias of 16.70 +/- 1.068 Watts, which is an average difference of about 18%. This is typical performance when riding on a gravel surface, where more noise and obstructions are present. When calibrated correctly, Cykelstrom provides acceptable power measurements for the the recreational gravel cyclist.
To see answers to commonly asked questions about Cykelstrom visit our FAQs
Strava Activity
Click on the map to visit this activity in Strava.
| Elapsed Time | Moving Time | Distance | Average Speed | Max Speed | Elevation Gain | Calories Burned |
|---|---|---|---|---|---|---|
|
02:14:43
hours
|
02:08:44
hours
|
26.71
mi.
|
12.45
mph
|
17.05
mph
|
200.13
ft.
|
976
kcal
|
Follow Cykelstrom Gravel Bike Power Meter App Test Rides On Strava
The Cykelstrom Road Bike Power Meter App Is Exclusively Available On Google Play