In this video, I am testing the mounting location of a Drift GhostX video camera on the handlebars of my Trek Top Fuel 8 full suspension mountain bike.
Testing a handlebar mounted camera on a Top Fuel 8 at Hartman Creek State Park
Comparing the Cykelstrom Bicycle Power Meter App to a single sided crank power meter
Elapsed Time
Moving Time
Distance
Average Speed
Max Speed
Elevation Gain
Calories Burned
01:14:28
hours
01:12:19
hours
8.08
mi.
6.70
mph
16.40
mph
540.03
ft.
940
kcal
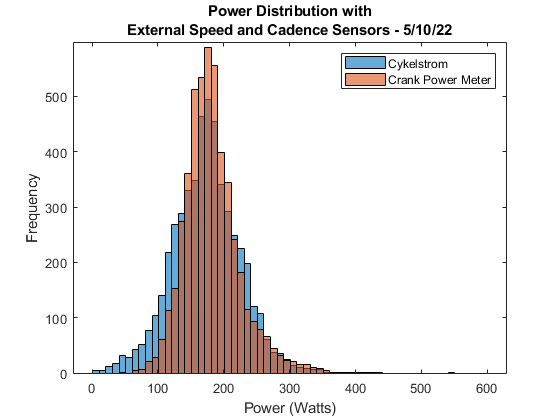
Nice day to ride in the woods at Hartman Creek State Park near Waupaca, Wisconsin. This was a test ride to compare the Cykelstrom Bicycle Power Meter App to a crank based power meter using only a cadence sensor. Speed information came from the GPS of the smartphone. The power meter used as the standard comparison was a 4iiii Precision Pro left sided Shimano XT crank.
Mountain Biking with the Cykelstrom Bicycle Power Meter App
Mountain biking and getting good power measurement data is certainly a challenge. The technology that Cykelstrom depends on is better suited to smooth steady and open conditions, like road cycling. The aggressive characteristics of mountain biking introduce a significant amount of noise to the signals Cykelstrom uses to calculate power. In addition, GPS signals can be difficult to obtain under heavy foliage or obstructions to the sky. Even though it is challenging, Cykelstrom appears to give acceptable data information, typically +/- 25% on average, but errors can be larger depending on conditions.
Remember, that when riding in a heavily sheltered area from the wind that it may be best to turn off the weather data and set wind speed to zero.
I am still studying the differences between full suspension and hardtail mountain bikes and as the data comes in I will share them in my posts. So check back often and if you wish to participate in my study, please contact me, developer@cykelstrom.com
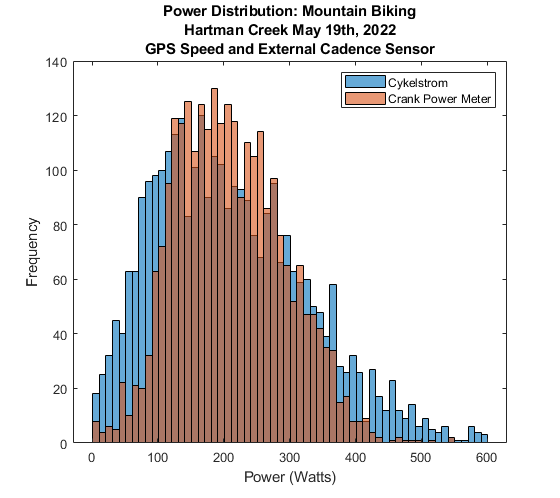
GPS Speed with External Cadence Sensor
Cykelstrom
Crank Power Meter
Difference (%)
Average Power
177.20
142.89
+ 24.08
Correlation
.3667
1
Standard Deviation
119.86
112.23
Cykelstrom Bicycle Power Meter App using GPS speed and external cadence sensor
When using Cykelstrom with GPS speed and an external cadence sensor, you can see that the data distribution is very similar to the crank power meter. This appears to be the best configuration and I recommend using an external cadence sensor.
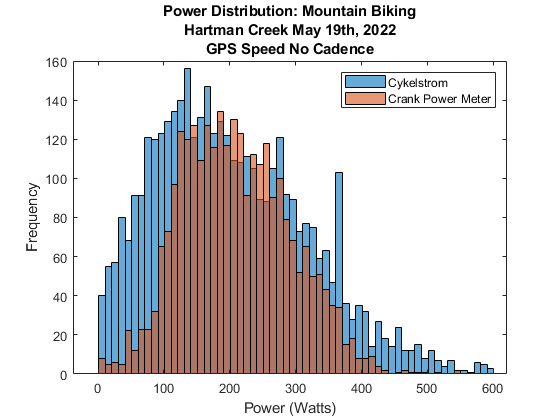
GPS Speed No External Sensors
Cykelstrom
Crank Power Meter
Difference (%)
Average Power
182.59
142.89
+ 27.78
Correlation
.3355
1
Standard Deviation
118.68
112.23
Cykelstrom Bicycle Power Meter App using GPS speed and no external sensors
When no external sensors are used, the shape of the data is similar to the crank power meter, however there is a lot of coasting and impulse like pedaling that occurs in mountain biking and Cykelstrom has a tendency to overestimate power in these circumstances.
Conclusion
Mountain biking conditions present challenges to smartphone applications that calculate power estimates, but if your are willing to accept the relative error they still provide useful information which further enhances your riding experience. For best results, use an external cadence sensor and if most of your riding is sheltered from the wind, turn off the weather data and set wind speed to zero.
After dinner we decided to go for a short bicycle ride and as expected I collected data using the Cykelstrom Bicycle Power Meter App.
Click on the map below to go to the “Developer’s Strava” account where you can observe the data visually.
Elapsed Time
Moving Time
Distance
Average Speed
Max Speed
Elevation Gain
Calories Burned
01:08:00
hours
01:02:08
hours
10.98
mi.
10.61
mph
18.52
mph
93.83
ft.
401
kcal
For this ride I rode my Trek Top Fuel 8 with a single sided 4iiii Precision crank power meter on a Shimano XT left sided crank as my measurement standard. As this was a family ride there were times where we were just screwing around, going in circles and many stops. I think this has a tendency to distort the data.
External Speed and Cadence Sensor
I used the cadence information from the power meter as it would be redundant to have another external sensor.
Cykelstrom
Power Meter
Difference (%)
Average Power (Watts)
100.2
87.4
14.6
Correlation
.7147
1
Standard Deviation
65.35
72.29
Table contains data for external speed and cadence sensors
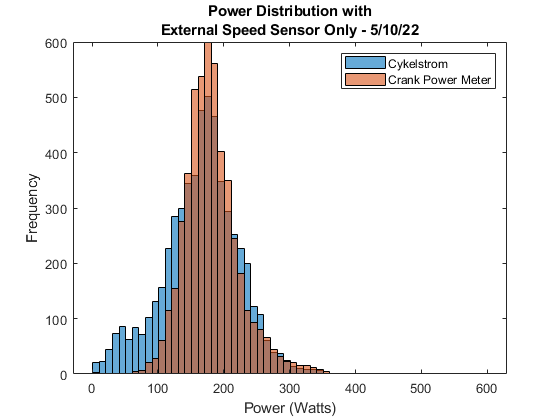
External Speed Sensor and No Cadence Sensor
Cykelstrom
Power Meter
Difference (%)
Average Power (Watts)
107.9
88.16
22.4
Correlation
.6191
1
Standard Deviation
60.64
72.17
Table contains data for external speed sensor and no cadence sensor
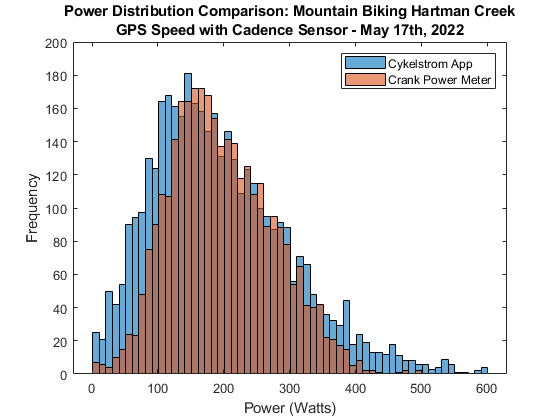
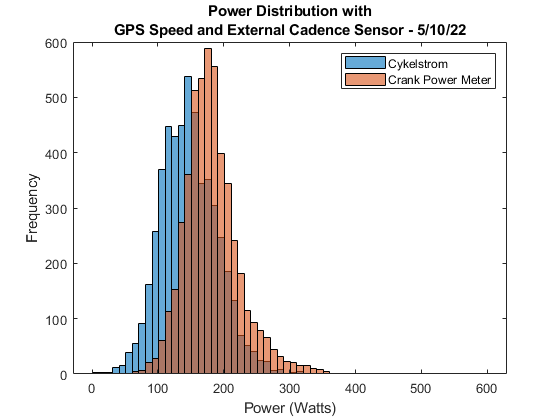
GPS Speed with Cadence Sensor
Cykelstrom
Power Meter
Difference (%)
Average Power (Watts)
76.10
87.40
– 12.9
Correlation
.7468
1
Standard Deviation
48.41
72.29
Table contains data for GPS speed with cadence sensor
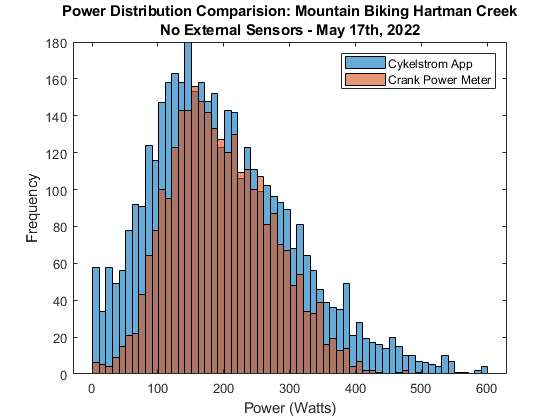
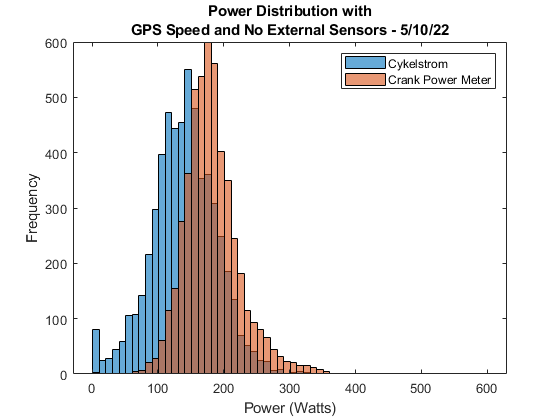
GPS Speed with No External Sensors
Cykelstrom
Power Meter
Difference (%)
Average Power (Watts)
81.58
88.16
– 7.5
Correlation
.6768
1
Standard Deviation
43.73
72.17
Table contains data for GPS speed and no external sensors
Discussion
This was an interesting ride to look at the data. There was a considerable difference between using an external speed sensor and the GPS speed data. The external speed sensor data over estimates the crank power meter. In this case, I am going to remeasure the circumference of my rear tire and make sure the value agrees with the ride parameters in Cykelstrom. An error like this can have a large impact on the accuracy of the power estimate by reporting a higher than normal speed.
When using the GPS for speed information Cykelstrom under reported the power estimate, however, it is much closer than the prior. The highest correlation was when I looked at using GPS speed information with the use of an external cadence sensor and this is reassuring. Some factors that may have an impact is that this was not a training ride and there was a lot of goofing around, tight circles and multiple stops. I believe this also plays a role.
Conclusion
Even though this was a pleasure ride, using the Cykelstrom Bicycle Power Meter App enhanced the experience of being out on the bicycle with my family. I hope you can do the same.
The following discussion compares the Cykelstrom Bicycle Power Meter App, which we will refer to as Cykelstrom and a 4iiii® Precision Pro 105 dual sided crank power meter as the control standard.
Bicycle
The bicycle used is a Diamondback Haanjo, which is a 11-speed gravel/adventure bicycle with drop bars. The rear tire is an American Classic Kimberlite 700C x 40 gravel tubeless tire with a pressure of 45 psi and a circumference of 2200 mm. The front tire was a tubeless Terravail Cannonball 700C x 42 with a pressure of 45 psi. The road surface is asphalt of somewhat marginal quality but typical for paved Midwest rural roads near Oshkosh, Wisconsin.
Smartphone and Sensors
Data was recorded simultaneously using the Cykelstrom Bicycle Power Meter App Version 1.15 on a Motorola G6 Android smartphone running API 26 Oreo. The smartphone used BluetoothSmart® to communicate with the power meter and speed sensor. Cadence reported by the power meter was used in place of an additional cadence sensor, which would have been redundant. The smartphone also recorded heart rate information from a Polar® H6 chest strap heart rate sensor. The external speed sensor is a Wahoo® BluetoothSmart® wireless sensor mounted on the hub of the rear tire.
Video of the ride associated with the data from this post, observe Cykelstrom in action.
After the ride was completed, Cykelstrom automatically uploaded its data and created a new activity in Strava® where the Cykelstrom data can be visually analyzed and performance metrics observed. Detailed information about this ride can be observed by going to the Developer’s Strava by clicking on the map below.
Elapsed Time
Moving Time
Distance
Average Speed
Max Speed
Elevation Gain
Calories Burned
01:41:58
hours
01:34:23
hours
23.87
mi.
15.17
mph
21.39
mph
427.17
ft.
1,070
kcal
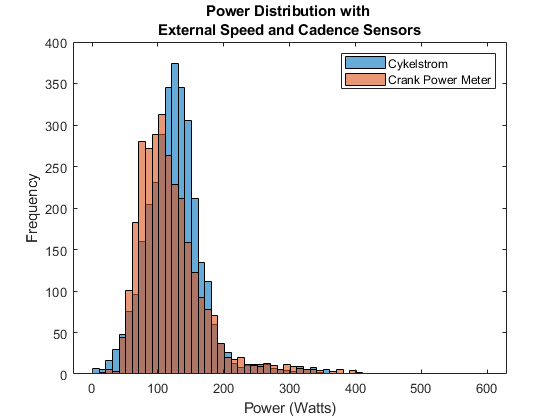
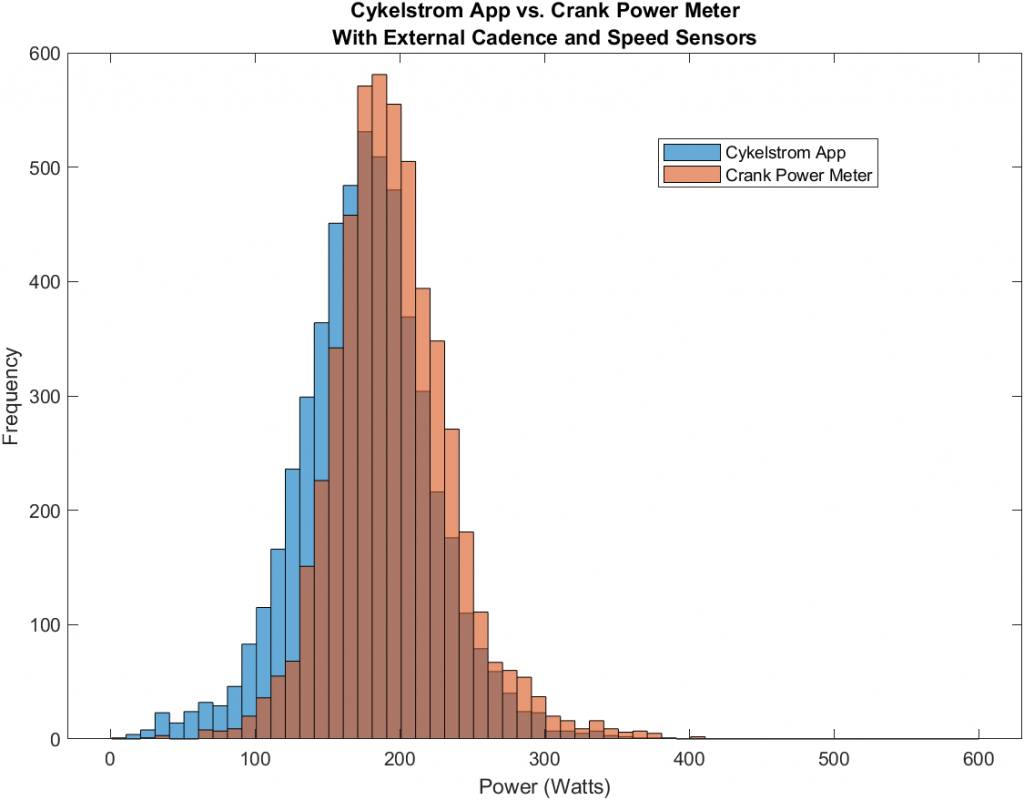
Using the ability to record data in a spreadsheet format, data was imported from the Cykelstrom Bicycle Power Meter App to a statistical analysis program. A power distribution chart of both Cykelstrom and the crank type power meter data was created for comparison. Each period in the distribution is 10 watts. The plotting of zero watts, or no power measurement, was excluded from the chart when coasting or being stopped was detected by a cadence value of zero if it was applicable.
External Speed and Cadence Sensors
Cykelstrom
Power Meter
Difference (%)
Average Power
154.20
166.92
-7.62
Correlation
.8143
1
Standard Deviation
72.16
78.61
Cykelstrom used an external speed sensor and cadence information in addition to the motion sensors inside the smartphone to create this power distribution colored in blue. The crank power meter distribution is in red. Although slightly different in shape, you can see that Cykelstrom approximates the crank power meter very closely. The addition of a speed sensor and cadence sensor yields the best correlation and accuracy to the crank power meter standard.
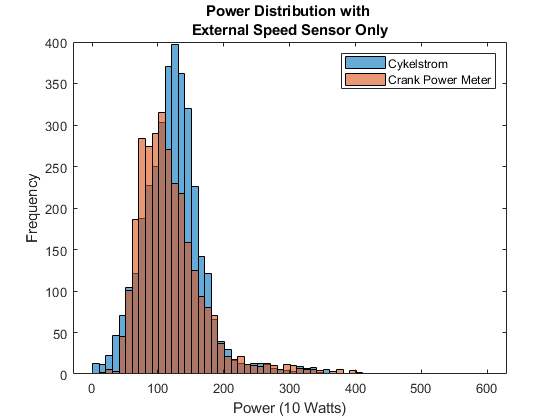
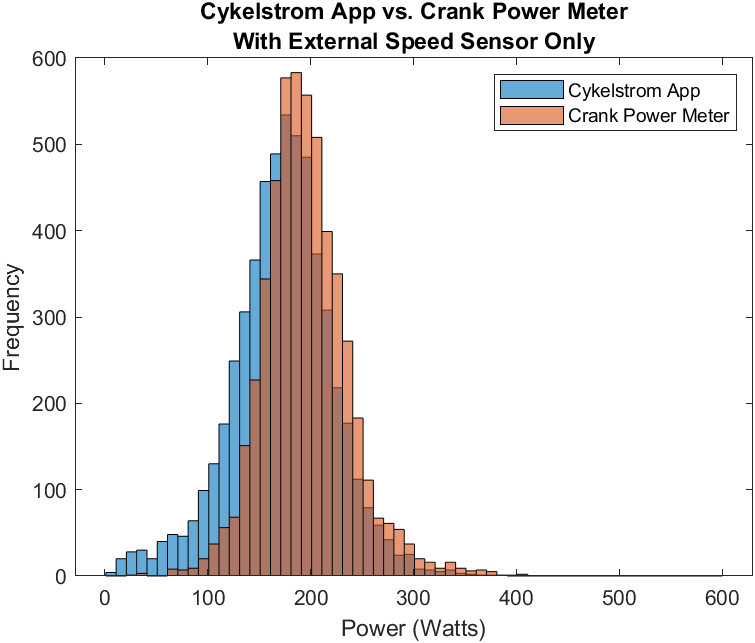
External Speed Sensor
Cykelstrom
Power Meter
Difference (%)
Average Power
156.90
166.97
-6.03
Correlation
.7685
1
Standard Deviation
68.64
78.55
In this example, the data represents performance while only using an external speed sensor. There is no cadence information. You can see the shape of the distribution remains very similar to the crank type power meter with a decrease in correlation. Overall averages remain very close to the crank type power meter. The 4iiii® Precision Pro power meter claims an accuracy of +/- 1 percent.
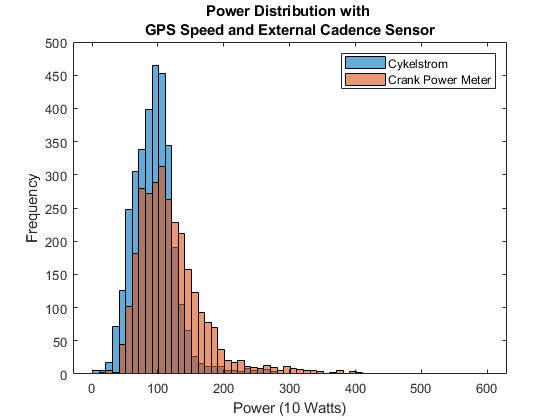
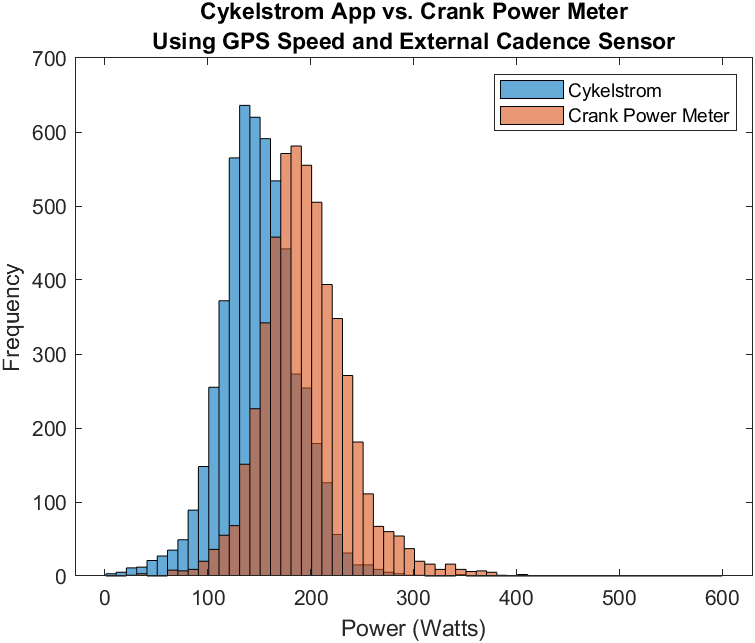
GPS For Speed and External Cadence Sensor
Cykelstrom
Power Meter
Difference (%)
Average Power
132.39
166.92
-20.69
Correlation
.7475
1
Standard Deviation
59.02
78.61
This example shows what happens when you rely on GPS speed information. The power distribution shapes remain very similar, however there is an offset introduced in the power estimates due to the differences in using GPS for speed vs. an external speed sensor. It is critical that the circumference of the tire that the speed sensor is located is measured precisely. Small errors in this measurement can distort the power estimate. I recommend using a flexible metric tape measure to measure your tire circumference at the tire pressure you prefer. Using GPS with a cadence sensor still gives good correlation, but the accuracy will decrease when compared to using an external speed sensor.
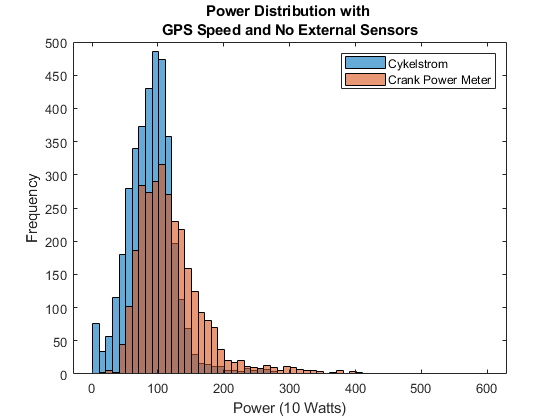
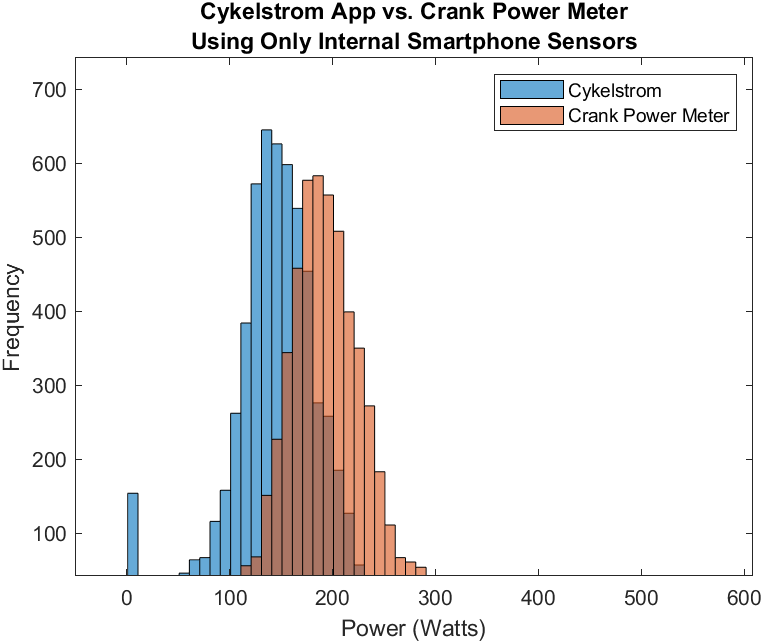
No External Sensors
Cykelstrom
Power Meter
Difference (%)
Average Power
154.20
166.97
-18.91
Correlation
.6846
1
Standard Deviation
54.80
78.55
Cykelstrom provides useful information even when used without any additional sensors. You only need your smartphone. The power distribution shape between Cykelstrom and the power meter are still very similar. There is an offset introduced by using GPS speed information and overall ride averages are consistent. Correlation is lowest when not using any sensors as may be expected.
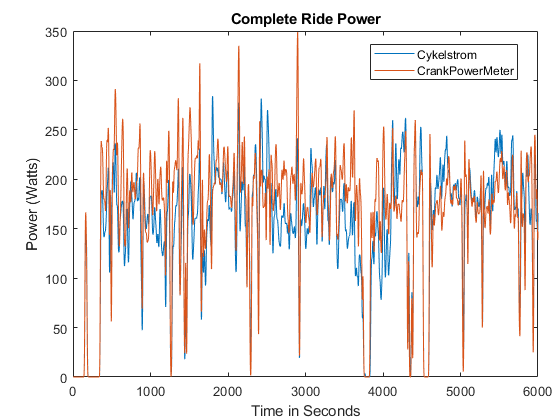
Time Series Comparison
Comparing the power distribution gives you a good idea that the power information is meeting the standard, however, when your riding you are observing the information in real time. The following charts give you and idea of how well Cykelstrom tracks the crank power meter in real time as you ride.
The chart above is displaying the power data for the duration of the entire ride. You can see that power fluctuates considerably when looking at the complete ride. This data is even smoothed on a ten second moving average basis. A better way is to look at the data for a segment of the ride.
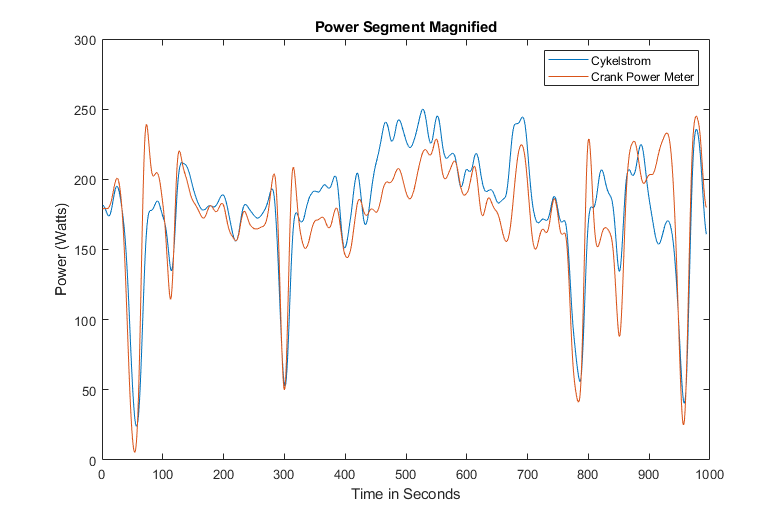
This ride segment is a portion of the data from the previous chart. When observing the data in a segment, it is easier to see that Cykelstrom tracks the crank power meter quite well. Data that tracks well gives higher correlation. This segment is a typical representation of how well Cykelstrom tracks the crank power meter in real time, or in other words, the power number you see while you ride. You have the option to display your average power for 1, 3, 5, 10, and 20 seconds.
Conclusion
The Cykelstrom Bicycle Power Meter App when used correctly can provide power estimates at a small fraction of the expense of crank type power meter. Cykelstrom improves it’s power estimates when combined with external speed and cadence sensors. If you have an external power meter, you can still use it to collect ride data and automatically upload it to Strava.
I hope you enjoyed this post and as always happy riding.