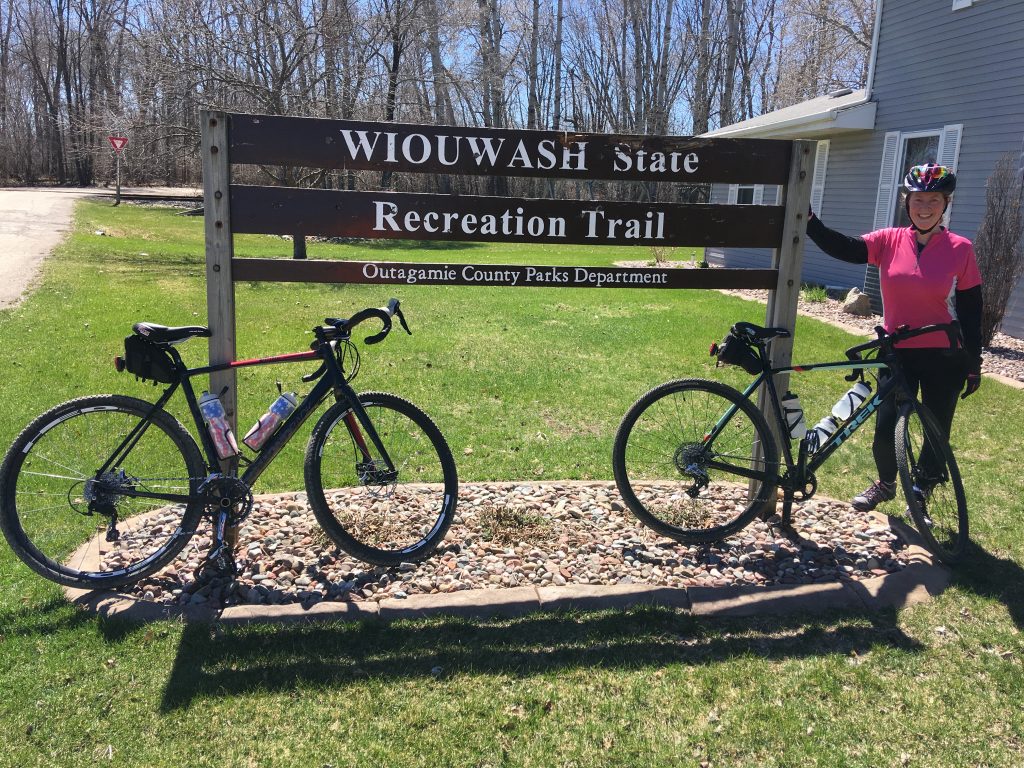
I gravel bike the Wiouwash Trail from the public parking area near Bare Bones Brewery in Oshkosh to Hortonville, Wisconsin round trip. The Cykelstrom Bicycle Power Meter App is presented on the video and added graphics are used to show how the app compares to a crank based power meter, a map, and a gauge which shows the grade of the trail.
If you would like to see more Cykelstrom Bicycle Power Meter App videos, please visit @Cykelstrom on YouTube and remember to “Like” and “Subscribe” to our channel.
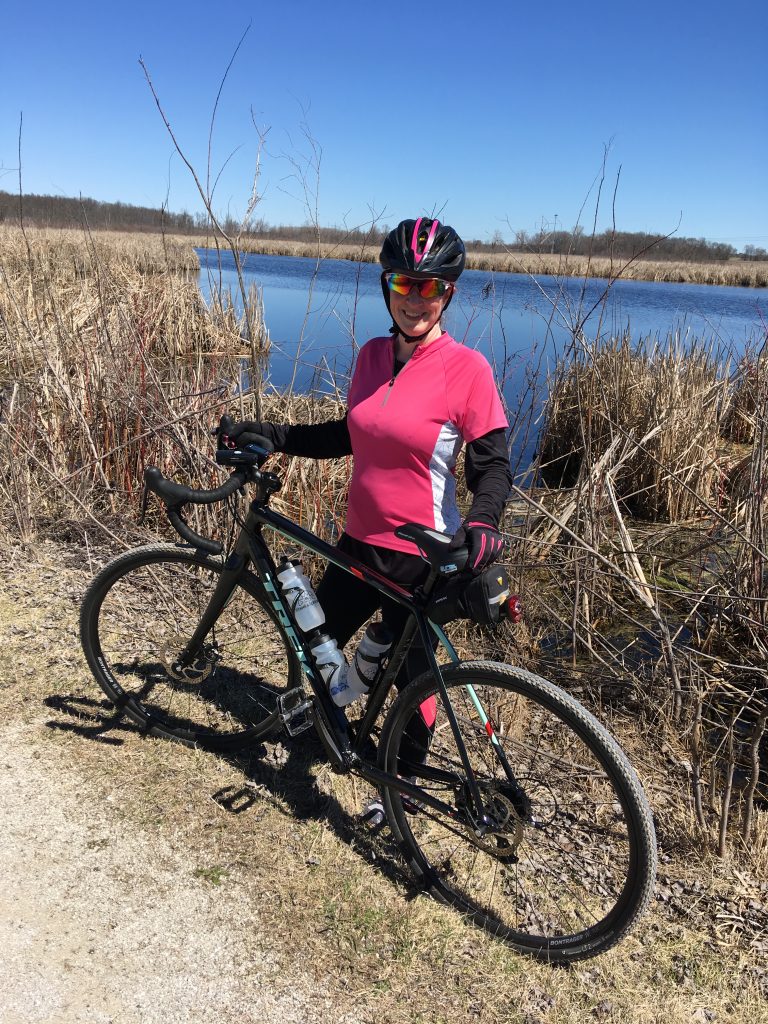
Trail Pic
Gravel Biking The Wiouwash Trail Cykelstrom Accuracy
The best accuracy for this ride is highlighted in bold.
| Sensors | Crank Power Meter (Watts avg.) | Cykelstrom (Watts avg.) | Difference (Watts) | Margin of Error (Watts) |
| External Speed and Cadence | 140.00 | 130.70 | -9.30 | +/- 0.9532 |
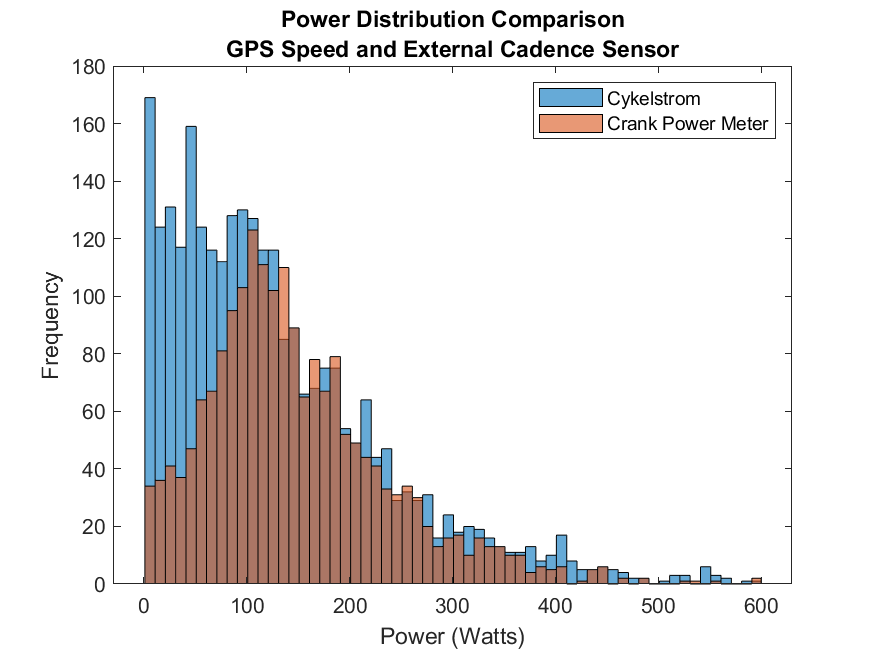
| GPS Speed and External Cadence | 140.00 | 121.52 | -18.48 | +/- 0.9534 |
| External Speed Only | 142.31 | 140.32 | -1.99 | +/- 1.12 |
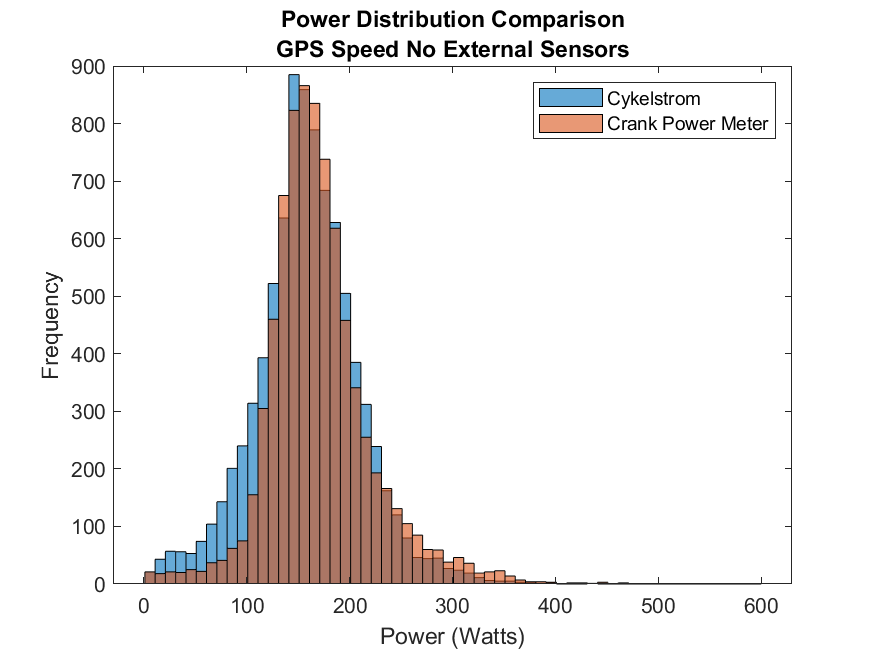
| GPS Speed Only | 142.31 | 127.98 | -14.32 | +/- 1.07 |
The Gravel Bike For This Test Ride
I rode a Diamondback Haanjo Comp as a gravel bike for this ride equipped with a 4iiii Precision Pro dual sided power meter on a Shimano 105 11-speed group set. The cadence sensors were Wahoo Bluetooth cadence and speed sensors. Heart rate information was collected with a Polar H6 chest strap sensor. The smartphone was a MotorolaG6 running Android Oreo and Cykelstrom version 1.36. All of the power meter and sensor data and was collected, saved locally and automatically uploaded to Strava with the Cykelstrom Bicycle Power Meter App.
Discussion Of This Ride’s Results
I have highlighted in bold the results from “External Speed and Cadence” and “External Speed Only.” I leave it to you to decide which is more accurate. I think this points out one of the disadvantages of looking at averages when comparing two methods of measurement.
I would have a tendency to think that the data measured with cadence would be more accurate, however the data shows less of a difference between averages when no cadence information is considered when measuring the cyclists power.
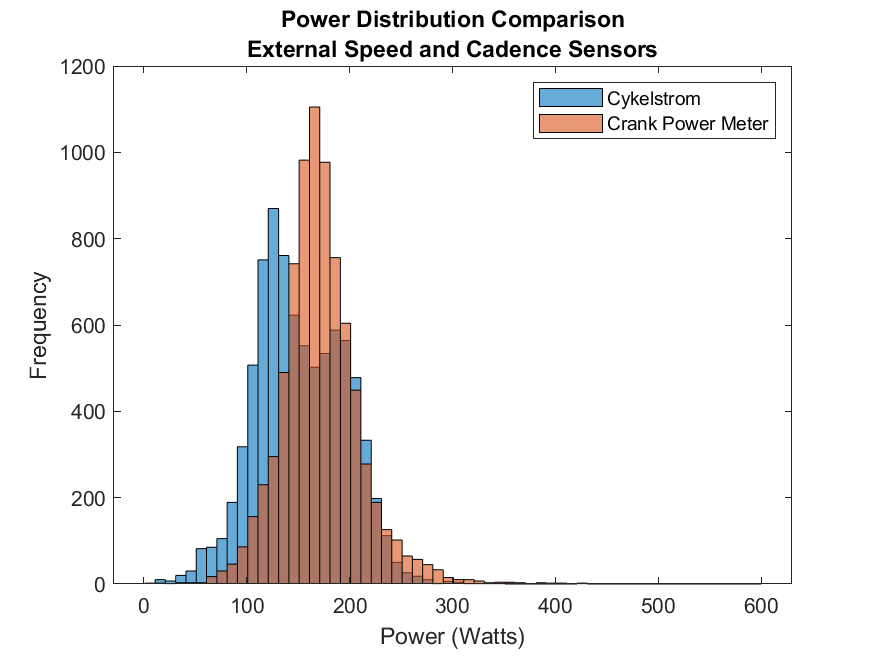
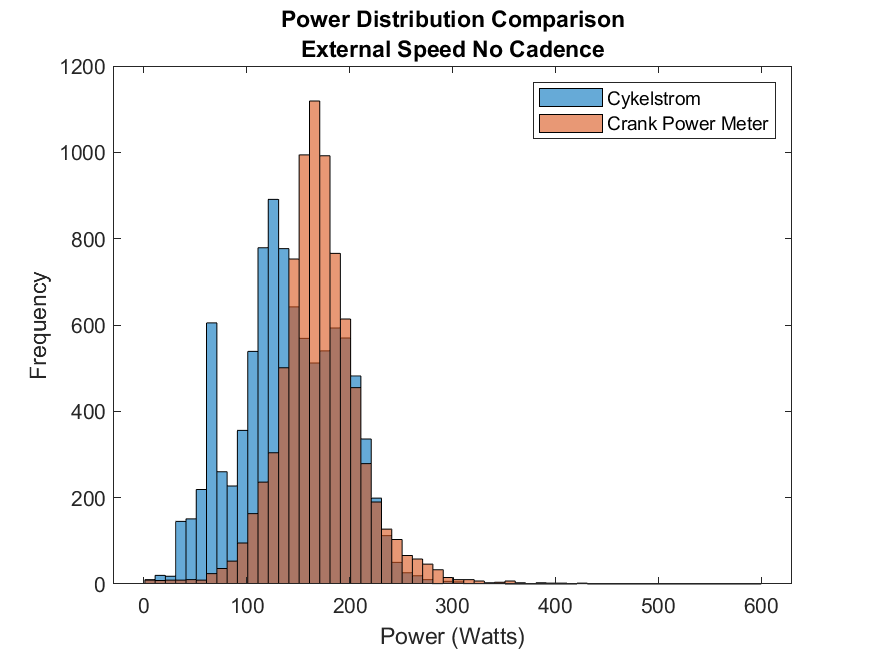
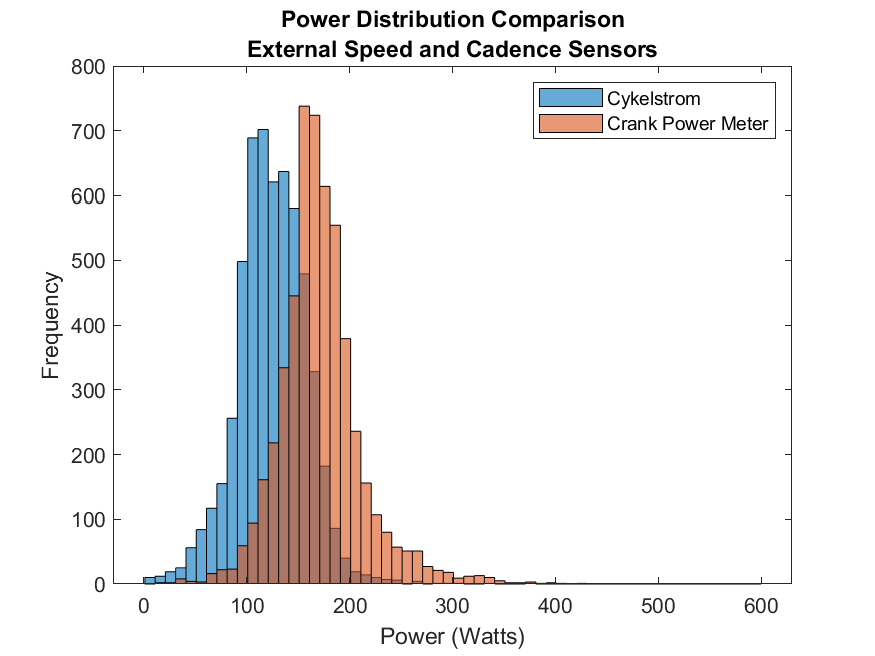
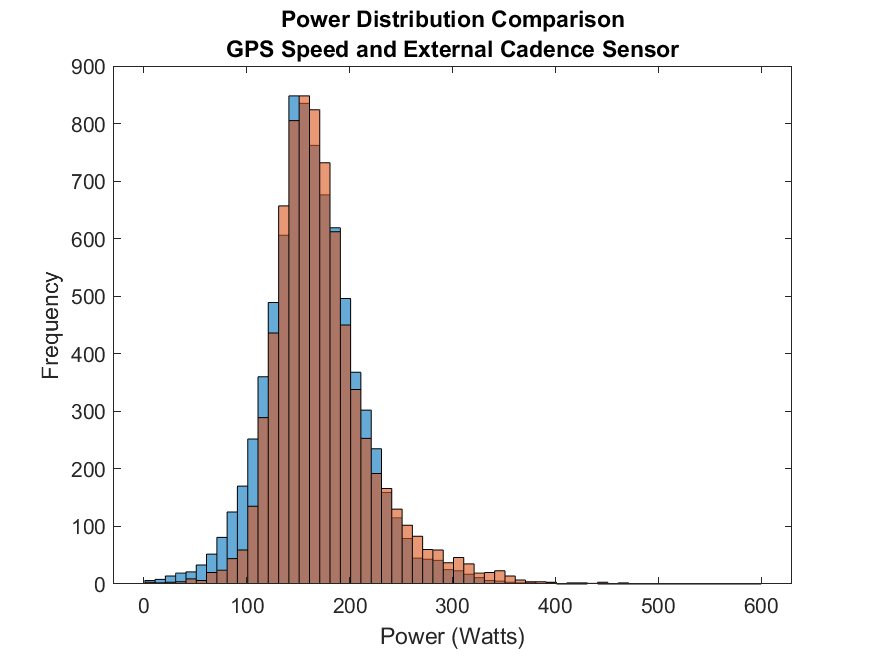
Looking at the shapes of the two distributions shows me two things. First, when considering cadence information the distributions appear to be more similar than when cadence information is ignored. Second, the Cykelstrom power distribution is multi-modal with a couple of peaks. I hypothesize that a wind shift during this particularly longer ride is represented in Cykelstrom’s calculated estimates of power.
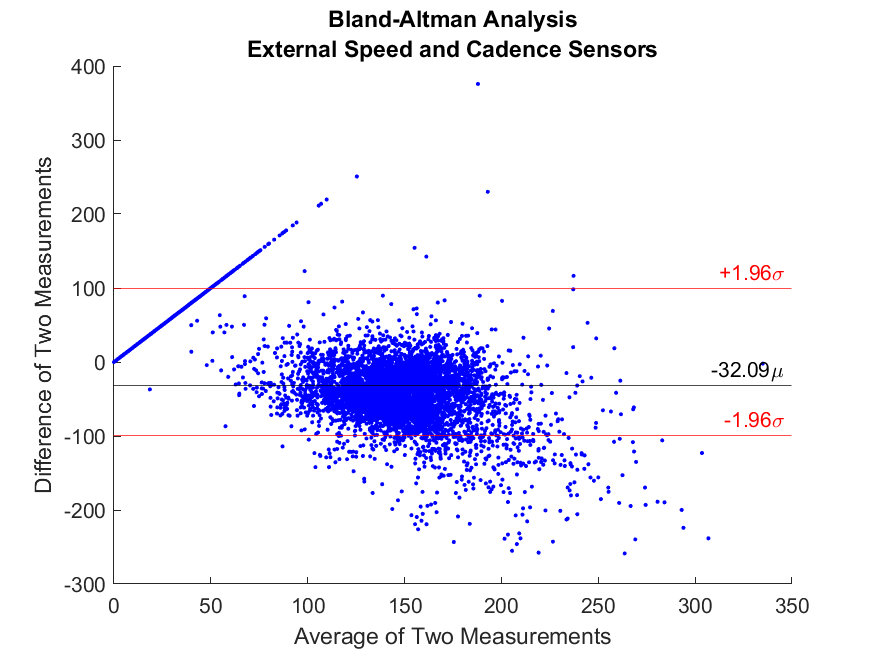
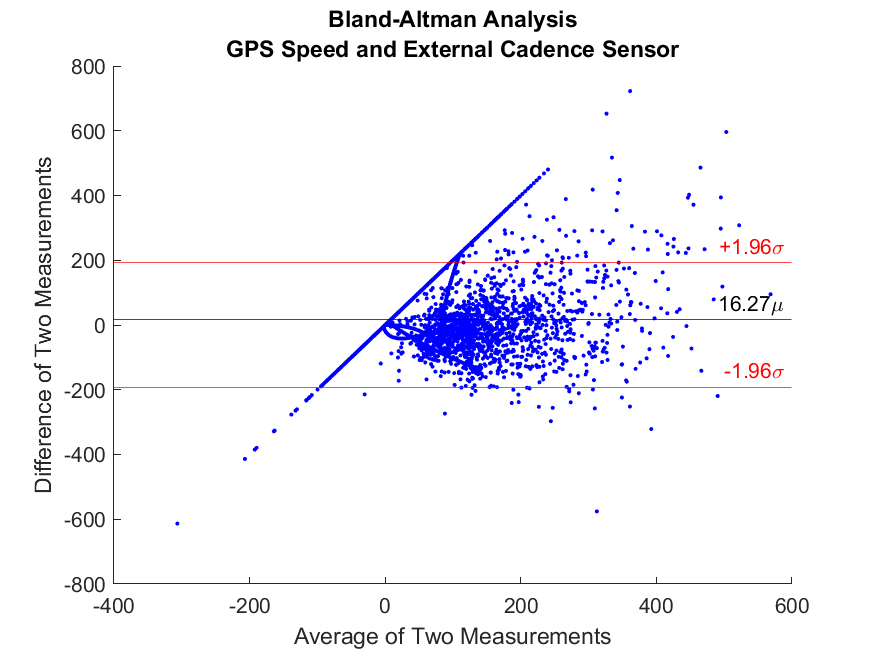
Bland-Altman Analysis
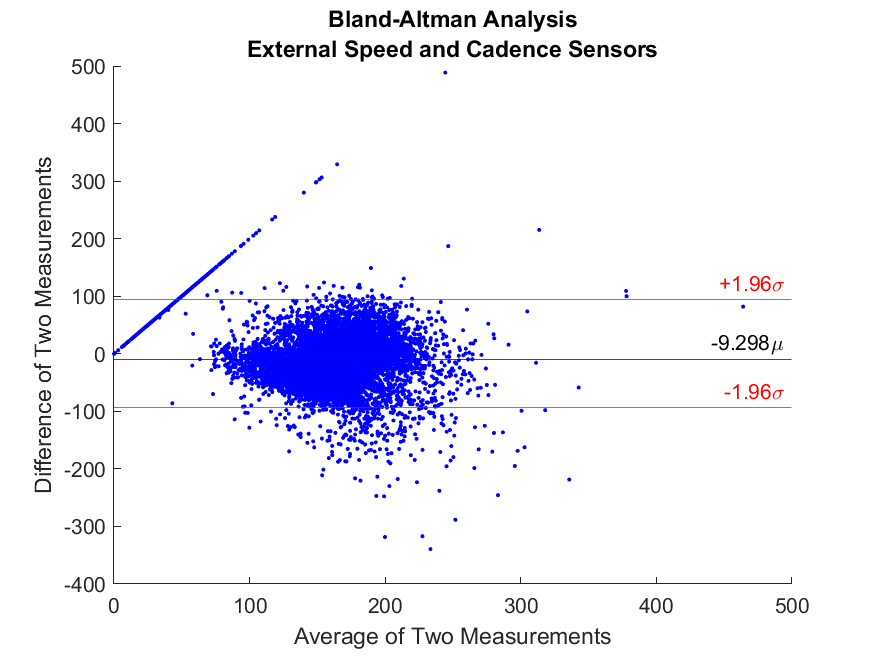
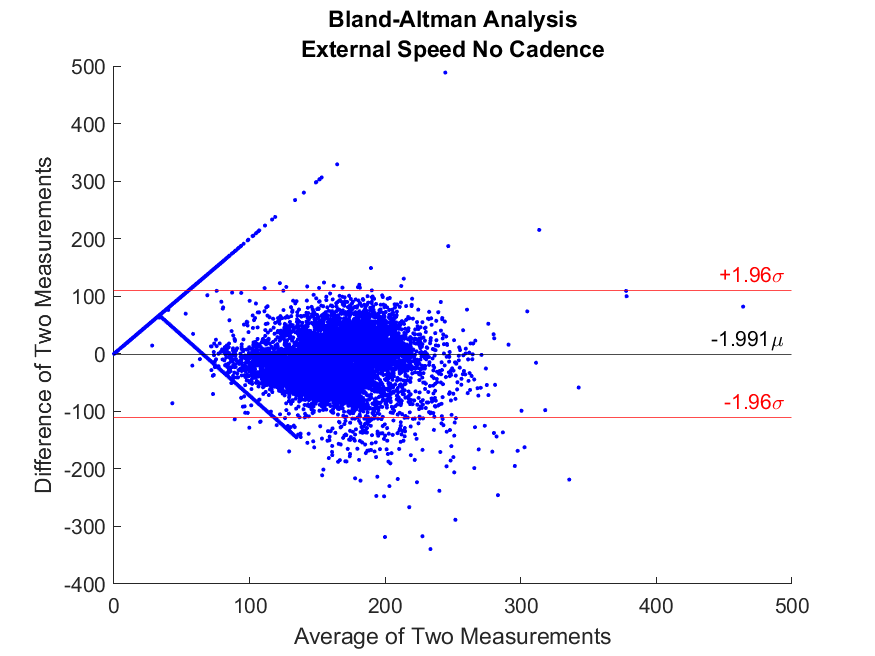
Other than the bias differences, these two data sets look very similar from this point of view.
I conclude that the Cykelstrom Bicycle Power Meter App provided particularly good power information to the cyclist when using a cadence senor. For information on how to set up a cadence sensor please see the article Adding Bluetooth Sensors To Cykelstrom.
Strava Activity
Click on the map to visit this activity in Strava.
| Elapsed Time | Moving Time | Distance | Average Speed | Max Speed | Elevation Gain | Calories Burned |
|---|---|---|---|---|---|---|
|
02:42:09
hours
|
02:25:38
hours
|
36.93
mi.
|
15.21
mph
|
19.56
mph
|
296.92
ft.
|
1,451
kcal
|
Follow Cykelstrom Gravel Bike Test Rides on Strava
The Cykelstrom Gravel Bike Power Meter App Is Exclusively Available On Google Play