Power Meter Cycling App Posts

Power Biking – Smartphone App Measures Cyclist’s Power

If you are interested in power biking and have a smartphone, you may be interested in observing your power output measured in watts. Smartphones typically have sensors that can be used to measure acceleration. Most smartphones also have a GPS receiver to determine your location and speed. Add some weather information and you have the makings of a power biking app.

Power Biking App Accuracy For This Ride

The best accuracy for this ride is highlighted in bold.

SensorsCrank Power Meter (Watts avg.)Cykelstrom (Watts avg.)Difference (Watts)Margin of Error (Watts)
External Speed and Cadence141.84142.380.53+/- 1.44
GPS Speed and External Cadence141.84139.71– 2.13+/- 1.62
External Speed Only142.96152.959.99+/- 1.67
GPS Speed Only142.96149.166.21+/- 1.41
Table created using Bland-Altman Analysis using a 4iiii Precision Pro dual sided crank power meter as the standard with 95% confidence level.

Discussion Of This Ride’s Results

This ride’s most accurate results are when external speed and external cadence sensors are used in conjunction with sensors internal to the smartphone. The smartphone used for this test ride was a Motorola G6 which has the Bosch BMI160 inertial measurement unit or IMU. I purchased this smartphone as a refurbished unit for around fifty dollars. The external cadence and speed sensors were purchased as a pair for around sixty dollars, however, you can find these sensors for a lot less. The cost of a typical power meter is easily five to ten times more expensive. The accuracy of a crank based power meter can be as good as +/- 1%, however, for me I am happy with accuracies +/- 10% and I like being able to move my smartphone to many different bikes.

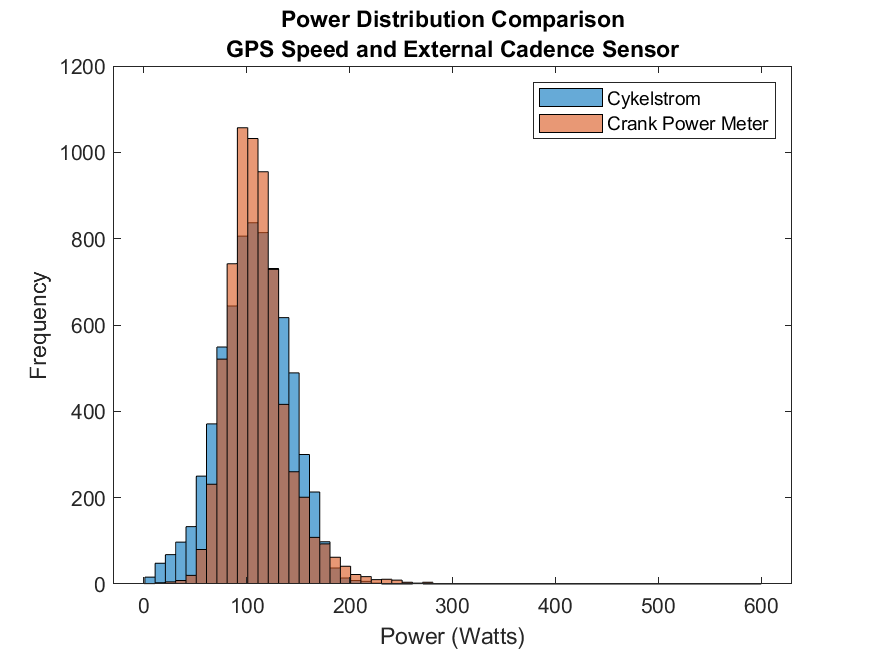
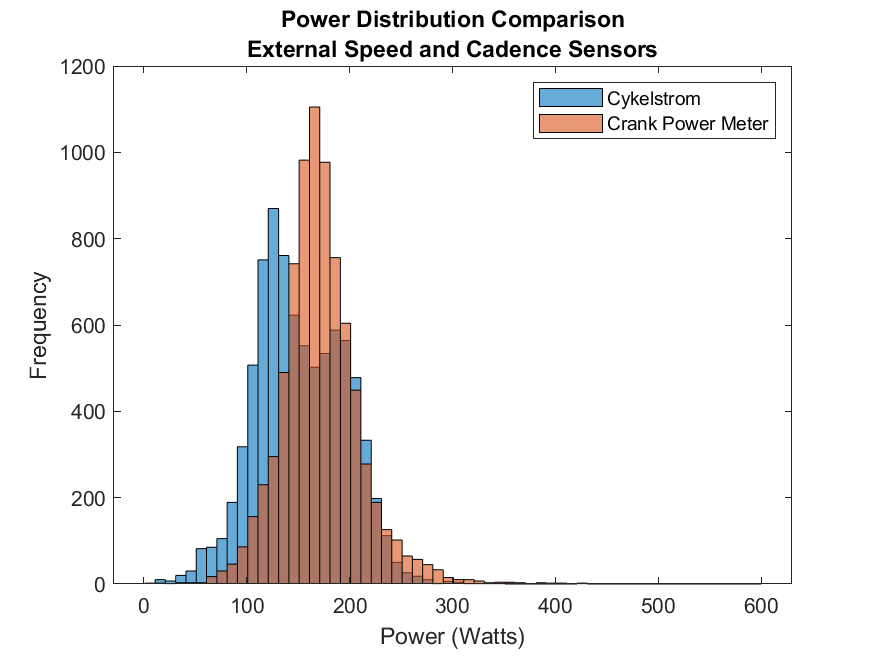
The following graph is a power distribution that compares the biking power meter app, Cykelstrom, to a dual sided crank based power meter.
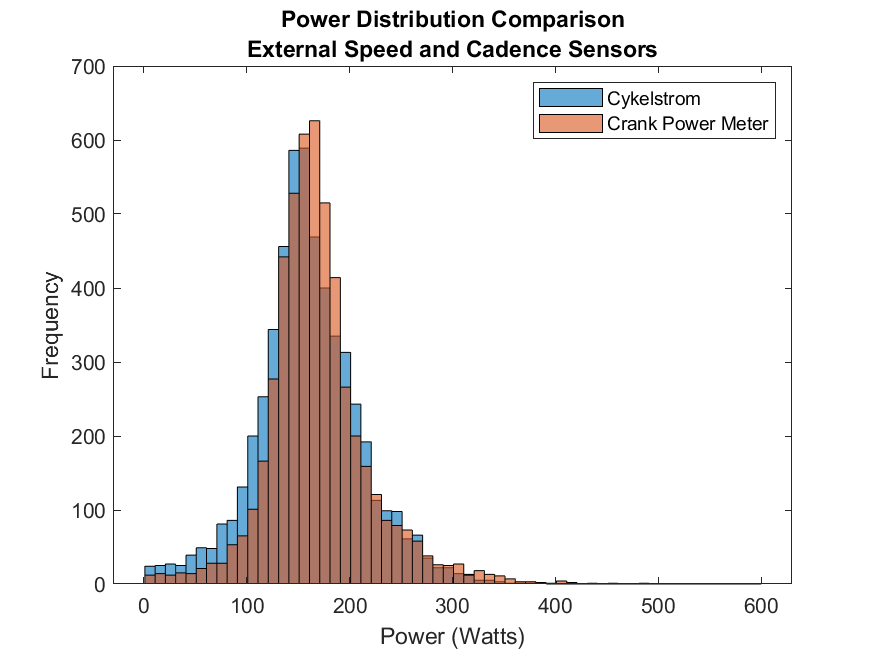
Power distribution comparison of Cykelstrom using and external speed and cadence sensor to a 4iiii Precision Pro dual sided crank power meter.

For an example of power distributions when riding a mountain bike please read Mountain Biking Hartman Creek State Park.

For a more detailed discussion of the power biking app and comparison to a crank power meter please read Power Distribution Comparison: Cykelstrom Bicycle Power Meter App vs. Crank Power Meter.

Strava Activity

Click on the map to visit this activity in Strava. Feel free to follow all of our test rides of the power biking app.

Elapsed Time Moving Time Distance Average Speed Max Speed Elevation Gain Calories Burned
01:42:42
hours
01:38:50
hours
25.38
mi.
15.41
mph
24.66
mph
448.16
ft.
1,037
kcal
Yesterday I felt the universe was conspiring against me by creating obstacles to prevent me from riding, i.e. flat tire, battery too low in the power meter, finally ready to ride and it starts raining…. So I listened and I didn't ride. Today, the universe was with me as it felt like I was riding a gravitational wave through the country. Never felt better or stronger. My app data was within .53 watts of the power meter +/- 1.4 watts. Pretty looking distribution curves and everything. Lesson learned: It pays to listen when the universe is speaking to you.

Follow Cykelstrom Test Rides On Strava

The Cykelstrom Power Biking App Is Only Available On Google Play

bicycle power meter app download button
Cykelstrom Bicycle Power Meter App Download
cykelstrom scan QR code
Scan to go to Cykelstrom on Google Play

Bike Power Meters – Mountain Bike On Rural Road Using The Cykelstrom App

These are the results of a short test ride using the Cykelstrom Bicycle/Bike Power Meter App compared to a crank type power meter.

Mountain Bike Power Meter App Accuracy For This Ride

SensorsCrank Power Meter (Watts avg.)Cykelstrom (Watts avg.)Difference (Watts)Margin of Error (Watts)
External Speed and Cadence100.5494.38– 6.17+/- 2.95
GPS Speed and External Cadence100.5489.71– 10.83+/- 2.91
External Speed Only101.69100.18– 1.51+/- 3.20
GPS Speed Only101.6994.94– 6.75+/- 3.15
Table created using Bland-Altman Analysis using a 4iiii Precision Pro single sided crank power meter as the standard with 95% confidence level.

Discussion of This Ride’s Results

We decided to do a short ride after dinner as we were both recovering from the Wausau 24Hr Endurance Mountain Bike Race from the previous weekend. Using Cykelstrom during that race taught me a few things about my racing. To see the video and read about the race please visit Cykelstrom Mountain Bike Power Meter App Test Ride – Wausau 24.

Back to this ride’s results, we can see that out of all of the combinations of using external sensor to not using any external sensors that the worst case scenario is within 14% of the standard power meter for this ride. The best case scenario was within 5% of the standard power meter. The surface of the road was fairly smooth. The mountain bike used was a Trek Top Fuel 8 with the suspension locked. With the suspension locked there was still some movement of the suspension so it was not like riding a hard tail or road bike. I believe the results of this ride reflect the moving suspension.

Strava Activity

Click on the map to visit this activity in Strava. Feel free to follow all of our test rides of the Cykelstrom Bike Power Meter App.

Elapsed Time Moving Time Distance Average Speed Max Speed Elevation Gain Calories Burned
00:20:23
hours
00:19:45
hours
4.45
mi.
13.53
mph
18.02
mph
58.73
ft.
135
kcal
Stacey wanted to go for a short ride after dinner. It was 90+ degrees Fahrenheit today and humid, but when the sun went behind the clouds it was pleasant to be riding

Follow Cykelstrom Test Rides On Strava

The Cykelstrom Bike/Bicycle Power Meter App Is Only Available On Google Play

bicycle power meter app download button
Cykelstrom Bicycle Power Meter App Download
cykelstrom scan QR code
Scan to go to Cykelstrom on Google Play

Cykelstrom Mountain Bike Power Meter App Test Ride – Wausau 24

With the Cykelstrom mountain bike power meter app revision 1.30 completed and tested on the local single track, it was time to give our app a test at the Wausau 24 endurance mountain biking race. I captured video of the first lap and included results for the first two laps of the race.

Video of the first lap of the Wausau 24 Endurance Mountain Bike Race

Mountain Bike Power Meter App Accuracy For Lap One

SensorsCrank Power Meter (Watts avg.)Cykelstrom (Watts avg.)Difference (Watts)Margin of Error (Watts)
External Speed and Cadence116.7123.87.1+/- 3.6
GPS Speed and External Cadence116.7101.5– 15.2+/- 3.4
External Speed Only119.2146.727.5+/- 4.2
GPS Speed Only119.2119.70.5+/- 3.9
Table created using Bland-Altman Analysis using a 4iiii Precision Pro single sided crank power meter as the standard with 95% confidence level.

Mountain Bike Power Meter App Accuracy For Lap Two

SensorsCrank Power Meter (Watts avg.)Cykelstrom (Watts avg.)Difference (Watts)Margin of Error (Watts)
External Speed and Cadence121.3141.520.2+/- 3.5
GPS Speed and External Cadence121.3109.1– 12.2+/- 3.3
External Speed Only122.8164.441.6+/- 4.0
GPS Speed Only122.8128.05.1+/- 3.8
Table created using Bland-Altman Analysis using a 4iiii Precision Pro single sided crank power meter as the standard with 95% confidence level.

Discussion Of This Ride’s Results

This test ride of Cykelstrom, demonstrates the challenges estimating power when riding in extreme conditions, like a heavy canopy.

During the ride, GPS reception was poor as indicated by the heading information using the magnetometer instead of GPS most of the time. Cykelstrom looks at the accuracy of the GPS heading information and will switch to the magnetometer if accuracy is low. It appears that since GPS accuracy was low, then other GPS derived data was not updated frequently enough to give good power estimates. For this reason, I recommend users of the Cykelstrom App use an external speed sensor and cadence sensor when GPS signals are unreliable. To learn how to add external Bluetooth sensors to Cykelstrom please visit Adding Bluetooth Sensors to Cykelstrom.

When using an external speed and cadence sensor, accuracy was greatly improved for this ride. The Cykelstrom mountain bike power meter app was within 6% at best and 17% at worst, on average, when compared to the standard crank power meter.

As the developer of Cykelstrom, I ride every opportunity possible to improve the app. Your suggestions and feedback are welcome at developer@cykelstrom.com.

Strava Activity

Click on the map to visit this activity in Strava. Feel free to follow all of our test rides of the Cykelstrom Bike Power Meter App. This is lap one of the Wausau 24 Race.

Elapsed Time Moving Time Distance Average Speed Max Speed Elevation Gain Calories Burned
01:30:13
hours
01:29:20
hours
10.82
mi.
7.27
mph
17.81
mph
682.74
ft.
894
kcal
First lap, started slow, caught back of pack in bottle necks anyway.

Follow Cykelstrom Test Rides On Strava

The Cykelstrom Bike/Bicycle Power Meter App Is Only Available On Google Play

bicycle power meter app download button
Cykelstrom Bicycle Power Meter App Download
cykelstrom scan QR code
Scan to go to Cykelstrom on Google Play

Cycling Power Meter App Live Stream Rides with the Cykelstrom Developer

Cycling Power Meter App Cykelstrom developer Chuck is starting to live stream his rides on YouTube. You can interact with Chuck through the YouTube chat window. This is a perfect time to talk to Chuck about the app. It’s also a great time to ask questions or say hello.

Cycling power meter app live stream recording of the country roads west of Oshkosh, Wisconsin

If you would like to see more Cykelstrom Bicycle Power Meter App videos, please visit @Cykelstrom on YouTube and remember to “Like” and “Subscribe” to our channel.

Bicycle, Smartphone, Sensors and Live Stream Equipment

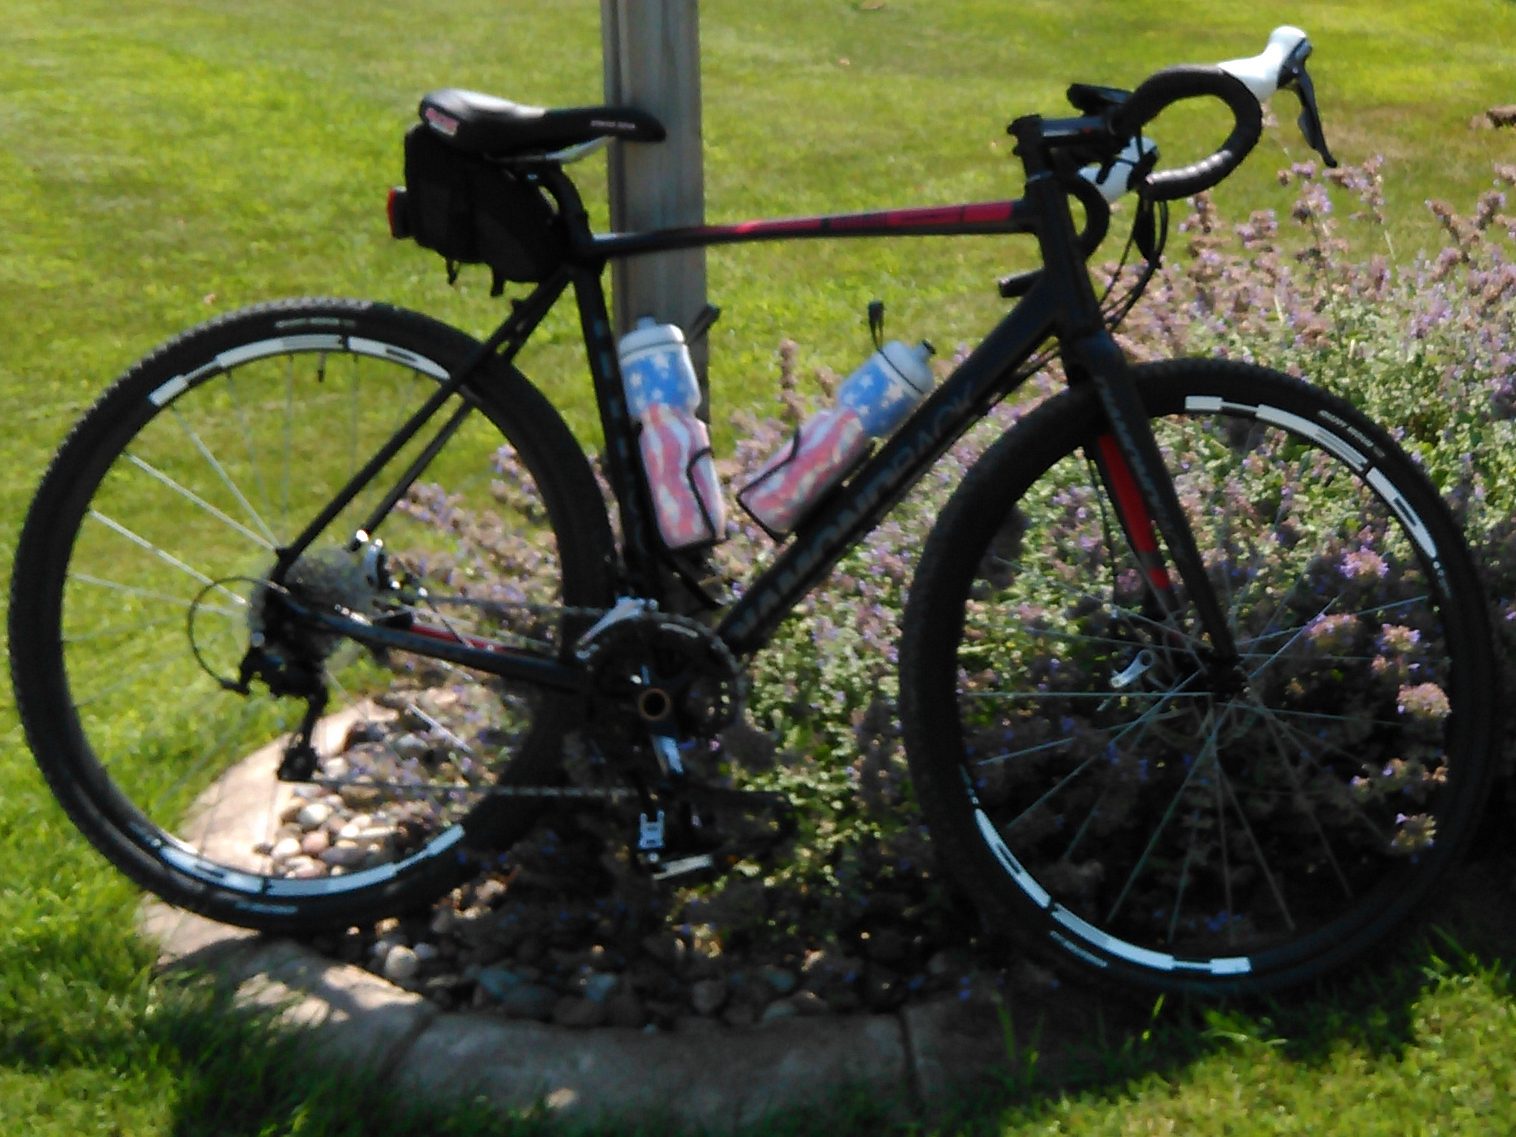
I rode a Diamondback Haanjo Comp as a gravel bike for this ride equipped with a 4iiii Precision Pro dual sided power meter on a Shimano 105 11-speed group set. The speed sensor was a Wahoo Bluetooth speed sensor and cadence information was provide by the power meter. A Polar H7 chest strap sensor collected heart rate information. The smartphone was a Motorola G6 running Android 9 and Cykelstrom version 1.73. The the Cykelstrom Bicycle Power Meter App collected the power meter and sensor data, saved it locally and automatically uploaded the data to Strava at the end of the ride.

A helmet mounted Ghost X action camera captured the live stream video. A Moxee 4G Lte WiFi hot spot sent the live stream to an Nginx server and streamed to YouTube with OBS Studio. The Prism Mobile App captured the Cykelstrom Cycling Power Meter App screen. I’ve attempted to keep the live stream equipment as simple as possible. Data stream cell service can be marginal at times when getting away from the city. I used the audio from the smartphone with a rudimentary home made wind screen. I am going to experiment with using the Ghost X camera audio with a windscreen in upcoming rides.

Cycling Power Meter App Accuracy For This Ride

Best accuracy for this ride is emphasized in bold type.

SensorsCrank Power Meter
(Watts avg.)
Cykelstrom
(Watts avg.)
Difference
(Watts)
Margin of Error
(Watts)
External Speed and Cadence123.29134.91+11.61+- 1.572
GPS Speed and
External Cadence
123.29131.29+8.00+- 1.524
External Speed Only124.36147.66+23.30+- 1.806
GPS Speed Only
(no additional sensors)
124.36143.37+19.01+- 1.757
Table created using Bland-Altman Analysis using a 4iiii Precision Pro dual sided crank power meter as the standard with 95% confidence level.

Discussion Of This Ride’s Results

I have emphasized in bold the results from “GPS Speed and External Cadence” as the most accurate. When compared to the dual sided power meter, Cykelstrom had a bias of 8.00 +/- 1.524 Watts which is an average difference of about 6% for the best case scenario. The worst case scenario shows a bias of 23.30 +/- 1.806 Watts, which is an average difference of about 19%. When calibrated correctly, Cykelstrom provides acceptable power measurements for the the recreational cyclist. If these results are not acceptable, Cykelstrom also connects to any Bluetooth power meter and the cyclist benefits by being able to see the power estimate fractions committed to wind resistance, rolling resistance, or grade assistance/resistance due to gravity.

To see answers to commonly asked questions about Cykelstrom visit our FAQs

Strava Activity

Click on the map to visit this activity in Strava.

Elapsed Time Moving Time Distance Average Speed Max Speed Elevation Gain Calories Burned
01:44:27
hours
01:44:27
hours
26.08
mi.
14.98
mph
22.91
mph
457.02
ft.
1,028
kcal
You can see part of the ride here: Still tuning in my settings for doing a live stream broadcast while riding. Graphics of the ride results and comparison to a dual sided crank power meter included in the pics.

The Cykelstrom Mission

The Cykelstrom mission is to maximize the ability of the athlete to utilize the technologies inherent in their existing Android smartphone to provide performance data for improvement of their physical fitness at little to no cost. The acquisition of athletic performance data can be expensive and out of the reach of many. Cycling power meters can often exceed the cost of the bicycle. Cykelstrom is an alternative that gives useful training data with out the expense.

The Cykelstrom Cycling Power Meter App leverages technology in newer and older smartphones. I attempt to make Cykelstrom backward compatible to the oldest Android operating system as practical. An old smartphone makes an excellent bicycle computer. Cykelstrom uses cellular data service, but it is not absolutely necessary. You can manually enter weather information and still get a good result.

Giving your old smartphone a new or dedicated mission helps keep it out of the landfill and delays the need for recycling.

The Cykelstrom Cycling Power Meter App is provided at no cost, but that doesn’t mean it’s development and data feeds are free. Please consider supporting the development of the Cykelstrom Power Meter App by “Buying Me A Coffee”.

The Cykelstrom Road Bike Power Meter App Is Exclusively Available On Google Play

bicycle power meter app download button
Cykelstrom Bicycle Power Meter App Download
cykelstrom scan QR code
Scan to go to Cykelstrom on Google Play

Bicycle Power Meter App Improves Accuracy Using Real Time Wind, Temperature and Pressure Information

Bicycle power meter apps, like Cykelstrom, utilize real-time weather data for accurate calculations. Factors such as wind resistance greatly affect a cyclist’s power estimate. Air density is crucial in determining power needed to overcome wind resistance. Cykelstrom uses current air density providing better power estimates than generic values alone.

Gravel biking the Wiouwash Trail in Wisconsin using the Cykelstrom Bicycle Power Meter App

If you would like to see more Cykelstrom Bicycle Power Meter App videos, please visit @Cykelstrom on YouTube and remember to “Like” and “Subscribe” to our channel.

Gravel Bike, Smartphone And Sensors

I rode a Diamondback Haanjo Comp as a gravel bike for this ride equipped with a 4iiii Precision Pro dual sided power meter on a Shimano 105 11-speed group set. The speed sensor was a Wahoo Bluetooth speed sensor and cadence information was provide by the power meter. Heart rate information was collected with a Polar H7 chest strap sensor. The smartphone was a Samsung A21 running Android 12 and Cykelstrom version 1.50. All of the power meter and sensor data was collected, saved locally and automatically uploaded to Strava with the Cykelstrom Bicycle Power Meter App at the end of the ride.

Gravel Bike Power Meter App Accuracy

The best accuracy for this ride is emphasized in bold.

SensorsCrank Power Meter
(Watts avg.)
Cykelstrom
(Watts avg.)
Difference
(Watts)
Margin of Error
(Watts)
External Speed and Cadence90.71103.40+12.68+- .9812
GPS Speed and
External Cadence
92.6395.08+4.37+- .9647
External Speed Only90.71109.33+16.70+- 1.068
GPS Speed Only
(no additional sensors)
92.63100.18+7.55+- 1.0625
Table created using Bland-Altman Analysis using a 4iiii Precision Pro dual sided crank power meter as the standard with 95% confidence level.

Discussion Of This Ride’s Results

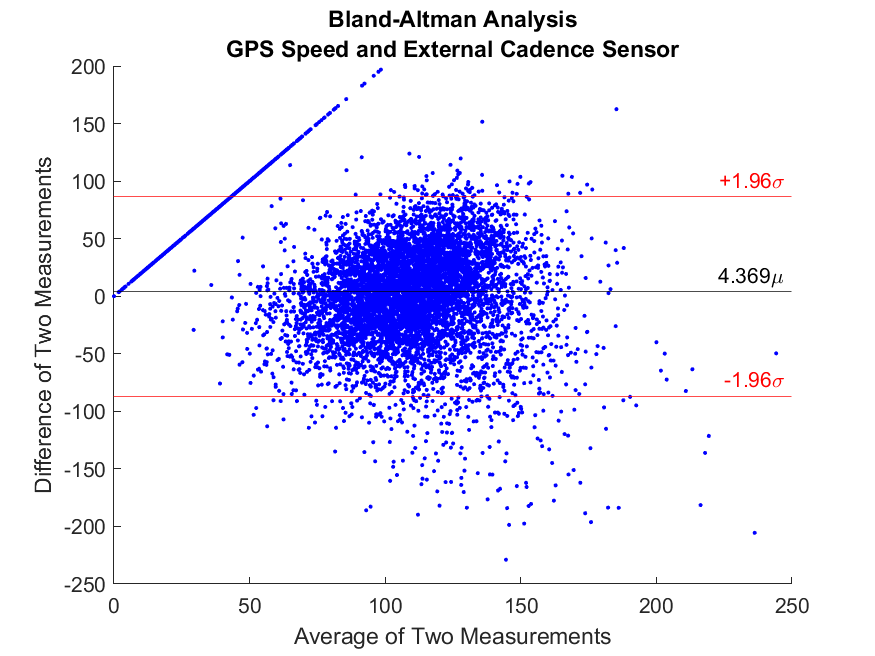
I have emphasized in bold the results from “GPS Speed and External Cadence” as the most accurate. When compared to the dual sided power meter, Cykelstrom had a small bias of 4.369 +/- .9647 Watts which is an average difference of about 5% for the best case scenario. The worst case scenario shows a bias of 16.70 +/- 1.068 Watts, which is an average difference of about 18%. This is typical performance when riding on a gravel surface, where more noise and obstructions are present. When calibrated correctly, Cykelstrom provides acceptable power measurements for the the recreational gravel cyclist.

To see answers to commonly asked questions about Cykelstrom visit our FAQs

Strava Activity

Click on the map to visit this activity in Strava.

Elapsed Time Moving Time Distance Average Speed Max Speed Elevation Gain Calories Burned
02:14:43
hours
02:08:44
hours
26.71
mi.
12.45
mph
17.05
mph
200.13
ft.
976
kcal
Nice recovery ride with Stacey.

Follow Cykelstrom Gravel Bike Power Meter App Test Rides On Strava

The Cykelstrom Road Bike Power Meter App Is Exclusively Available On Google Play

bicycle power meter app download button
Cykelstrom Bicycle Power Meter App Download
cykelstrom scan QR code
Scan to go to Cykelstrom on Google Play

Fat Tire Snow Biking Hartman Creek State Park Green Loop – December 28th, 2022

Fat tire snow biking in Wisconsin is unpredictable where we live. Trail conditions need to be monitored very closely. If it is too warm, the groomed trails can be ruined for the remainder of the winter. The temperatures this winter are unusually warm which makes for only a few good days to ride. The volunteers and trail stewards are doing an excellent job grooming and keeping the trails in excellent condition. Hartman Creek State Park is a great place to snow bike and you can check current conditions by going to the Cronies Trail Crew Facebook Page.

Snow biking the green loop at Hartman Creek State Park – December 28th, 2022

If you would like to see more Cykelstrom Bicycle Power Meter App videos, please visit @Cykelstrom on YouTube and remember to “Like” and “Subscribe” to our channel.

The Fat Tire Snow Bike For This Ride

fat tire snow biking
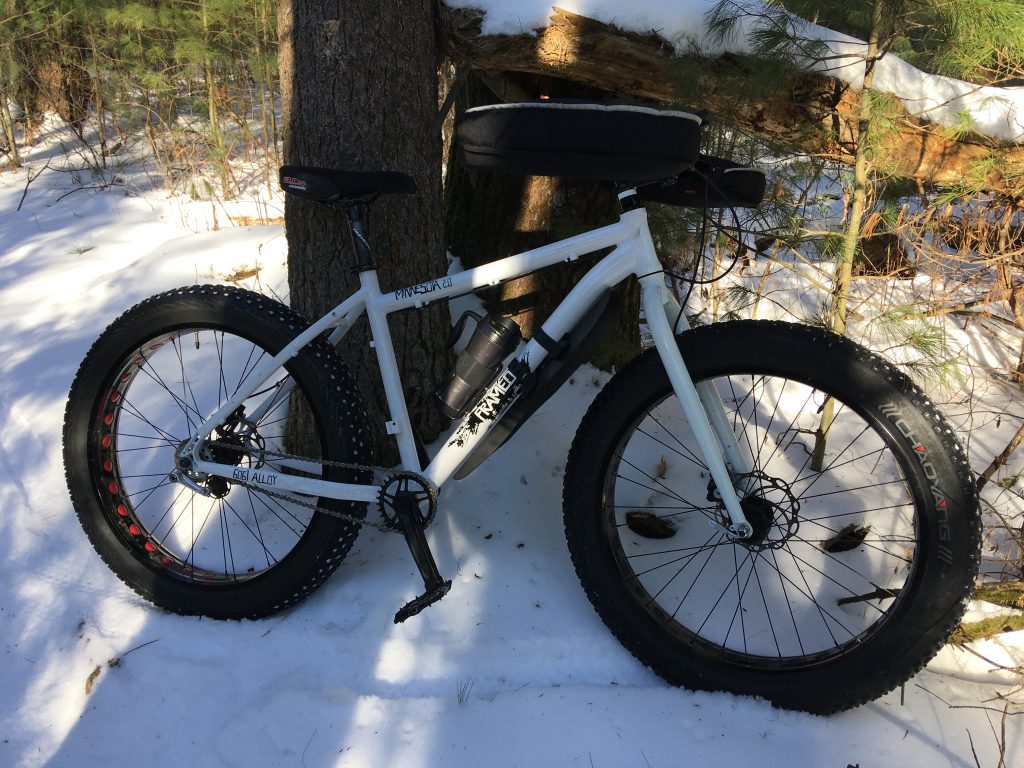
Fat tire snow bike endearingly named Snowball

Built from many components from other bikes, the fat tire snow bike, named snowball, is a single speed. The tires are four inches wide and depending on snow conditions I use between 4 to 8 psi of pressure. The softer the snow conditions the lower the tire pressure used. If tire pressure is too low, the rolling resistance becomes unbearable and you can burn a lot of energy going nowhere.

The Cykelstrom Bicycle Power Meter App has a setting called “Fat Tire Mode” under the settings portion of the options menu. Fat tire mode modifies the power estimate calculation to account for the higher rolling resistance of the four inch tires. To learn more about how to configure settings, see the article Customizing Cykelstrom Through Settings.

Strava Activity

Click on the map to visit this activity in Strava.

Elapsed Time Moving Time Distance Average Speed Max Speed Elevation Gain Calories Burned
00:46:24
hours
00:42:08
hours
4.83
mi.
6.88
mph
11.78
mph
175.52
ft.
291
kcal
Green loop at Hartman Creek State Park.

Follow Cykelstrom Test Rides On Strava

The Cykelstrom Snow Bike Power Meter App Is Available Exclusively On Google Play

bicycle power meter app download button
Cykelstrom Bicycle Power Meter App Download
cykelstrom scan QR code
Scan to go to Cykelstrom on Google Play

Hartman Creek State Park Mountain Biking Green, Blue and Black Loops – November 2nd, 2022

I ride Hartman Creek State Park mountain biking green, blue and black trails, possibly for the last time before snow. It was very difficult to see the trail in some places due to all the fallen leaves. I ride here enough that I could do it blind folded, but the leaves covering some of the roots and rocks made for some interesting moments.

Hartman Creek State Park Green, Blue and Black Loop Single Track Mountain Bike Trails – November 2nd, 2022

If you would like to see more Cykelstrom Bicycle Power Meter App videos, please visit @Cykelstrom on YouTube and remember to “Like” and “Subscribe” to our channel.

The Mountain Bike For This Ride

Trek Top Fuel 8, Hartman Creek State Park Mountain Biking
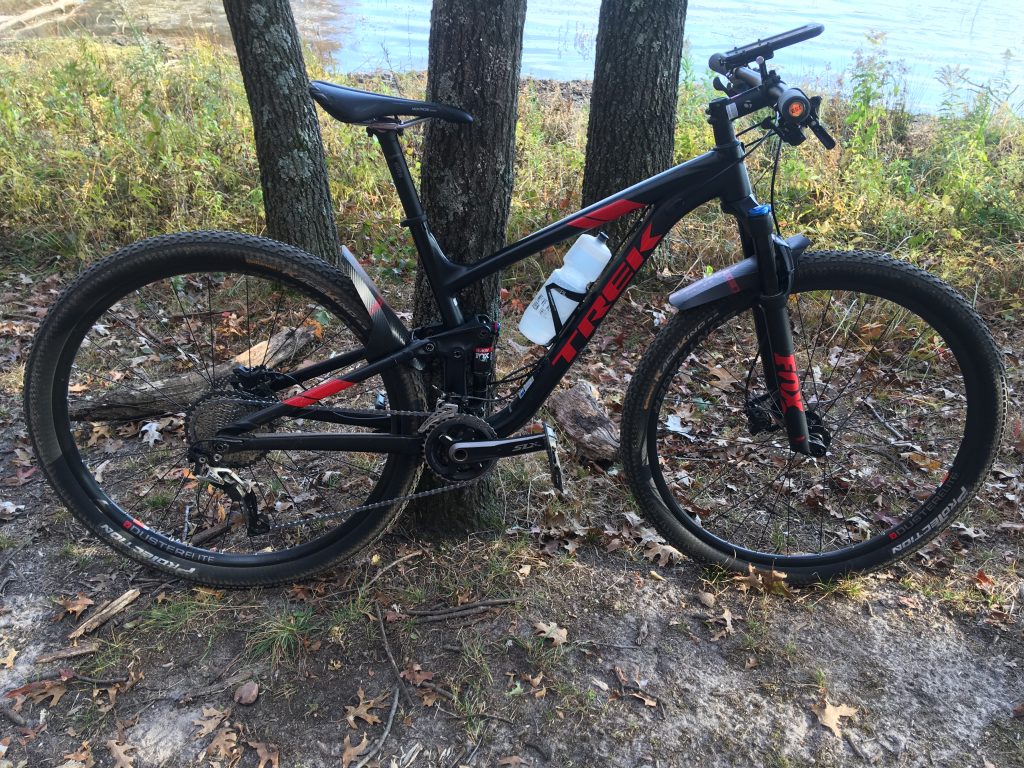
Chuck’s Trek Top Fuel 8

I rode a Trek Top Fuel 8 as a full suspension mountain bike for this ride equipped with a 4iiii Precision Pro left sided power meter on a Shimano SLX 11-speed group set. Cykelstrom collected cadence information from the power meter. Cykelstrom collected speed information using a Wahoo Bluetooth speed sensor. A Polar H7 chest strap sensor collected heart rate information. The smartphone was a MotorolaG6 running Android Oreo and Cykelstrom version 1.36. All of the power meter and sensor data was collected, saved locally, and automatically uploaded to Strava with the Cykelstrom Bicycle Power Meter App.

Mountain Biking App Accuracy For This Ride

The best accuracy is highlighted in bold.

SensorsCrank Power Meter (Watts avg.)Cykelstrom (Watts avg.)Difference (Watts)Margin of Error (Watts)
External Speed and Cadence112.73101.08-11.64+/- 2.19
GPS Speed and External Cadence112.7394.33-18.40+/- 2.25
External Speed Only114.06120.436.38+/- 2.62
GPS Speed Only114.06113.41-0.65+/- 2.71
Table created using Bland-Altman Analysis using a 4iiii Precision Pro left sided crank power meter as the standard with 95% confidence level.

Hartman Creek State Park Mountain Biking Results

The smallest bias but highest margin of error occurred when no additional sensors were used. The only sensors involved are internal to the Motorola G6 smartphone that was used during this test ride. The average difference between the power meter and the Cykelstrom App was only -0.65 +/- 2.71 watts. This represents a difference in the averages of only 0.5%. Getting good results like this are dependent on riding style in that I did not coast much during the ride. If you are the type of rider that pedals constantly, the need for a cadence sensor is minimal.

The smallest margin of error is represented when an external speed and cadence sensor were used. The average bias was -11.64 +/- 2.19 watts. If you are the type of rider who likes to coast a lot, then I recommend using a cadence sensor.

In all cases, for this ride, Cykelstrom was within 16.3% on average of the crank power meter. This is acceptable for most recreational mountain bike riders using a full suspension mountain bike on typical single track terrain and conditions.

If you would like to learn more about setting Cykelstrom up for a ride like this visit the article “Customizing Cykelstrom Through Settings.”

Strava Activity

Click on the map to visit this activity in Strava.

Elapsed Time Moving Time Distance Average Speed Max Speed Elevation Gain Calories Burned
01:23:02
hours
01:19:39
hours
10.50
mi.
7.91
mph
14.50
mph
558.73
ft.
653
kcal
What a leafy day. The ride was made interesting by leaves obscuring the trail, roots, rocks, sand traps and drops. Fortunately, I remember just about every feature, so I could ride with only a few surprises. I did have a couple of angular roots jump out and try to toss my rear wheel off of the trail which made for some exciting moments.

Follow Cykelstrom Test Rides on Strava

The Cykelstrom Mountain Bike Power Meter App Is Available Exclusively On Google Play

bicycle power meter app download button
Cykelstrom Bicycle Power Meter App Download
cykelstrom scan QR code
Scan to go to Cykelstrom on Google Play

Waukau Dam Mountain Bike Trail – November 1st, 2022

Waukau Dam Mountain Bike Trail is a great place to get in a little mountain biking when you don’t have the time to go very far from Oshkosh, Wisconsin.

Waukau Dam Mountain Bike Trails – Waukau, Wisconsin – November 1st, 2022

If you would like to see more Cykelstrom Bicycle Power Meter App videos, please visit @Cykelstrom on YouTube and remember to “Like” and “Subscribe” to our channel.

The Mountain Bike For This Ride

waukau dam mountain bike, waukau dam, trek top fuel
Trek Top Fuel 8

I rode a Trek Top Fuel 8 as a full suspension mountain bike for this ride equipped with a 4iiii Precision Pro left sided power meter on a Shimano SLX 11-speed group set. Cykelstrom collected cadence information from the power meter. Cykelstrom used a Wahoo Bluetooth speed sensor to collect speed information. A Polar H7 chest strap sensor collected heart rate information. The smartphone was a MotorolaG6 running Android Oreo and Cykelstrom version 1.36. All of the power meter and sensor data and was collected, saved locally and automatically uploaded to Strava with the Cykelstrom Bicycle Power Meter App.

To learn how to set Cykelstrom up to automatically upload your ride data to Strava visit the article “Upload Your Ride Data To Strava.”

Waukau Dam Mountain Bike Trail Ride Cykelstrom Accuracy

The best accuracy is highlighted in bold.

SensorsCrank Power Meter (Watts avg.)Cykelstrom (Watts avg.)Difference (Watts)Margin of Error (Watts)
External Speed and Cadence99.7487.80-11.94+/- 2.79
GPS Speed and External Cadence99.7481.34-18.39+/- 2.95
External Speed Only99.20100.120.92+/- 3.11
GPS Speed Only99.2093.85-5.34+/- 3.31
Table created using Bland-Altman Analysis using a 4iiii Precision Pro left sided crank power meter as the standard with 95% confidence level.

Discussion of This Ride’s Results

The smallest margin of error occurred when an external speed and cadence sensors were used. This specific ride was a lot of stop and go riding while I was figuring out the layout of the trail system. There was never a long stretch of riding and the trail system is contained in a very small area. Most of the trail is mountain goat, hillside, ledge-type riding.

Waukau Dam Mountain Bike Trail Strava Activity

Click on the map to visit this activity in Strava.

Elapsed Time Moving Time Distance Average Speed Max Speed Elevation Gain Calories Burned
00:54:16
hours
00:47:51
hours
6.18
mi.
7.75
mph
14.57
mph
610.56
ft.
334
kcal
So it's been awhile, I thought I would see what's new at the Waukau Dam Trail.

Follow Cykelstrom Test Rides On Strava

The Cykelstrom Mountain Biking App Is Exclusively Available On Google Play

bicycle power meter app download button
Cykelstrom Bicycle Power Meter App Download
cykelstrom scan QR code
Scan to go to Cykelstrom on Google Play

Road Bike Power Meter App – Ride West of Oshkosh, Wisconsin – October 28th, 2022

Road bike power meter app ride west of Oshkosh, Wisconsin demonstrates the Cykelstrom Bicycle Power Meter App.

Road bike power meter app demonstration ride west of Oshkosh, Wisconsin – October 28th, 2022

If you would like to see more Cykelstrom Bicycle Power Meter App videos, please visit @Cykelstrom on YouTube and remember to “Like” and “Subscribe” to our channel.

The Road Bike For This Test Ride

road bike power meter
The bike I use for road and gravel rides – Diamondback Haanjo Comp

I rode a Diamondback Haanjo Comp as a road bike for this ride equipped with a 4iiii Precision Pro dual sided power meter on a Shimano 105 11-speed group set. The speed sensor was a Wahoo Bluetooth speed sensor and cadence information was provide by the power meter. Heart rate information was collected with a Polar H7 chest strap sensor. The smartphone was a MotorolaG6 running Android Oreo and Cykelstrom version 1.36. All of the power meter and sensor data was collected, saved locally and automatically uploaded to Strava with the Cykelstrom Bicycle Power Meter App at the end of the ride.

Road Bike Power Meter App Accuracy

The best accuracy for this ride is emphasized in bold.

SensorsCrank Power Meter (Watts avg.)Cykelstrom (Watts avg.)Difference (Watts)Margin of Error (Watts)
External Speed and Cadence155.27163.017.74+/- 1.64
GPS Speed and External Cadence155.27158.603.33+/- 1.60
External Speed Only156.10169.3313.23+/- 1.76
GPS Speed Only156.10164.468.36+/- 1.71
Table created using Bland-Altman Analysis using a 4iiii Precision Pro dual sided crank power meter as the standard with 95% confidence level.

Discussion Of This Ride’s Results

I have emphasized in bold the results from “GPS Speed and External Cadence” as the most accurate. When compared to the dual sided power meter, Cykelstrom had a small bias of 3.33 +/- 1.60 Watts which is an average difference of about 2%. Results like these are typical when riding on smooth surfaces like tarmac roads. When calibrated correctly, Cykelstrom provides acceptable power measurements for the the recreational road cyclist.

What If You Did Not Use A Cadence Sensor?

For this particular ride, if you had no sensors and just relied on the internal sensors of the smartphone, you would observe that the bias was 8.36 +/- 1.71 Watts which is an average difference of about 5%. This accuracy would also be acceptable to most recreational road cyclists with the following condition. Since cadence information is not collected in this case, the rider would need to keep their coasting to a minimum. When I ride on the road, I seldom coast and pedal all of the time. This is why the results excluding the cadence sensor are so close to when a cadence sensor was used.

Adding A Cadence Sensor

For best accuracy, I recommend the use of an external Bluetooth cadence sensor. If you would like to learn more about how to add Bluetooth sensors to the Cykelstrom App please visit the article “Adding Bluetooth Sensors to Cykelstrom.”

Strava Activity

Click on the map to visit this activity in Strava.

Elapsed Time Moving Time Distance Average Speed Max Speed Elevation Gain Calories Burned
01:36:36
hours
01:36:06
hours
25.34
mi.
15.82
mph
23.29
mph
437.99
ft.
1,090
kcal
Not sure how many more days I can get away with this kind of ride this year. Hopefully, just one more?

Follow Cykelstrom Road Bike Power Meter App Test Rides On Strava

The Cykelstrom Road Bike Power Meter App Is Exclusively Available On Google Play

bicycle power meter app download button
Cykelstrom Bicycle Power Meter App Download
cykelstrom scan QR code
Scan to go to Cykelstrom on Google Play

Standing Rocks County Park Mountain Biking – October 23rd, 2022

Standing Rocks County Park in Stevens Point, Wisconsin is where Stacey and I ride in this video. We ride the trails “Super Dooper Looper” and “Green Goblin.” The video presents the Cykelstrom Bicycle Power Meter App and uses graphics to demonstrate how the app compares to a crank based power meter.

Standing Rocks County Park Mountain Bike Trails October 23rd, 2022

To see more Cykelstrom Bicycle Power Meter App videos, please visit @Cykelstrom on YouTube and remember to “Like” and “Subscribe” to our channel.

Standing Rocks County Park Trail Pic

Standing Rocks County Park, Stevens Point Wisconsin, Super Dooper Looper
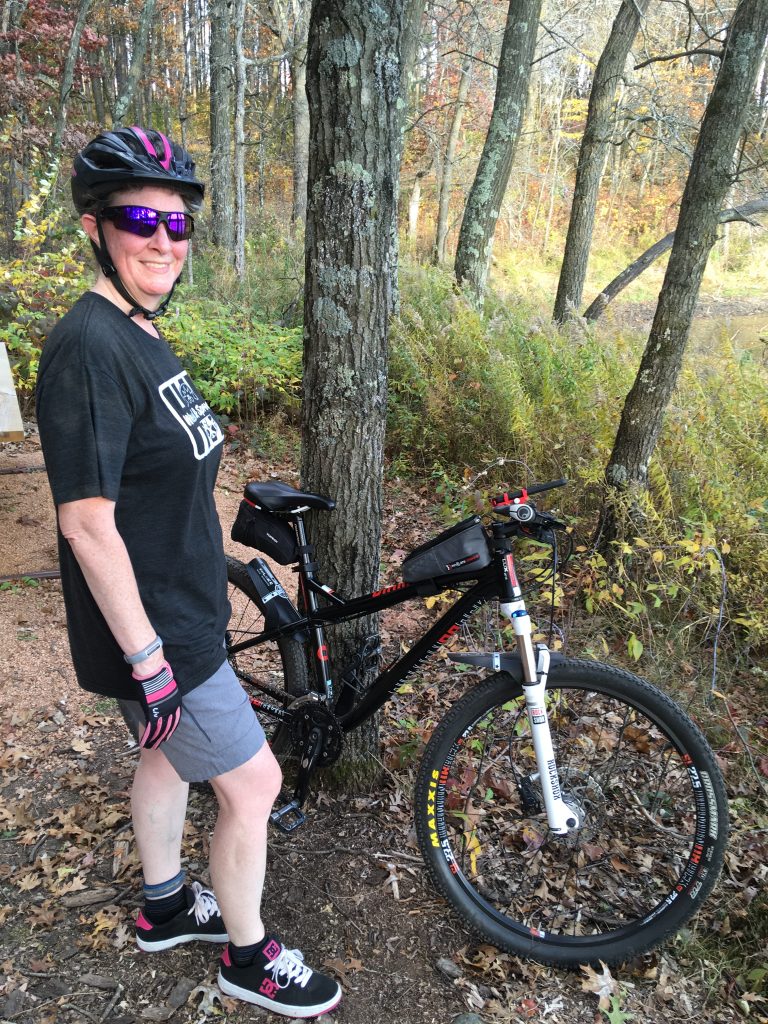
Stacey with Diamondback Lux Comp
Standing Rocks County Park, Stevens Point Wisconsin, Super Dooper Looper
Chuck’s Trek Top Fuel 8

Mountain Biking Standing Rocks County Park Cykelstrom Accuracy

The best accuracy for this ride is highlighted in bold.

SensorsCrank Power Meter (Watts avg.)Cykelstrom (Watts avg.)Difference (Watts)Margin of Error (Watts)
External Speed and Cadence84.8979.63-5.26+/- 1.99
GPS Speed and External Cadence84.8969.60-15.29+/- 2.14
External Speed Only86.25105.1618.91+/- 2.56
GPS Speed Only86.2595.389.12+/- 2.78
Table created using Bland-Altman Analysis using a 4iiii Precision Pro left sided crank power meter as the standard with 95% confidence level.

The Mountain Bike For This Test Ride

I rode a Trek Top Fuel 8 as a full suspension mountain bike for this ride equipped with a 4iiii Precision Pro left sided power meter on a Shimano SLX 11-speed group set. Cadence information was collected by Cykelstrom from the power meter. Speed information was collected by Cykelstrom using a Wahoo Bluetooth speed sensor. Heart rate information was collected with a Polar H7 chest strap sensor. The smartphone was a MotorolaG6 running Android Oreo and Cykelstrom version 1.36. All of the power meter and sensor data and was collected, saved locally and automatically uploaded to Strava with the Cykelstrom Bicycle Power Meter App.

Discussion Of This Ride’s Results

Highlighted in bold are the results from “External Speed and Cadence” as the most accurate in the table above. The Standing Rocks County Park mountain bike trail “Super Dooper Looper” has a lot of climbing with short punchy rollers, table tops, berms, and jumps. The trees were well canopied while we were riding and GPS speed information was affected. When riding in sheltered or heavy canopied areas, GPS information is not as reliable as also having external Bluetooth sensors equipped on your bike. For more information about how to add Bluetooth sensors to the Cykelstrom Mountain Biking Power Meter App visit the article “Adding Bluetooth Sensors to Cykelstrom.”

Strava Activity – Standing Rocks County Park

Click on the map to visit this activity in Strava.

Elapsed Time Moving Time Distance Average Speed Max Speed Elevation Gain Calories Burned
01:28:12
hours
01:12:43
hours
8.20
mi.
6.77
mph
13.12
mph
562.99
ft.
549
kcal
Introduced Stacey to Standing Rocks County Park today. She appears ready to tackle the mandatory gap jump on Super Dooper Looper.

Follow Cykelstrom Mountain Bike Test Rides on Strava

The Cykelstrom Mountain Bike Power Meter App Is Exclusively Available On Google Play

bicycle power meter app download button
Cykelstrom Bicycle Power Meter App Download
cykelstrom scan QR code
Scan to go to Cykelstrom on Google Play

Mountain Biking Greenbush In The Kettle Moraine State Forest, October 21st, 2022

Mountain Biking Greenbush single track trails demonstrates the Cykelstrom Bicycle Power Meter App while riding in the Kettle Moraine State Forest in Glenbeulah, Wisconsin.

Greenbush Single Track Mountain Bike Trail – Kettle Moraine State Forest Glenbeulah, Wisconsin

If you would like to see more Cykelstrom Bicycle Power Meter App videos please visit: @Cykelstrom on YouTube and remember to “Like” and “Subscribe” to our channel.

Greenbush Trail Pics

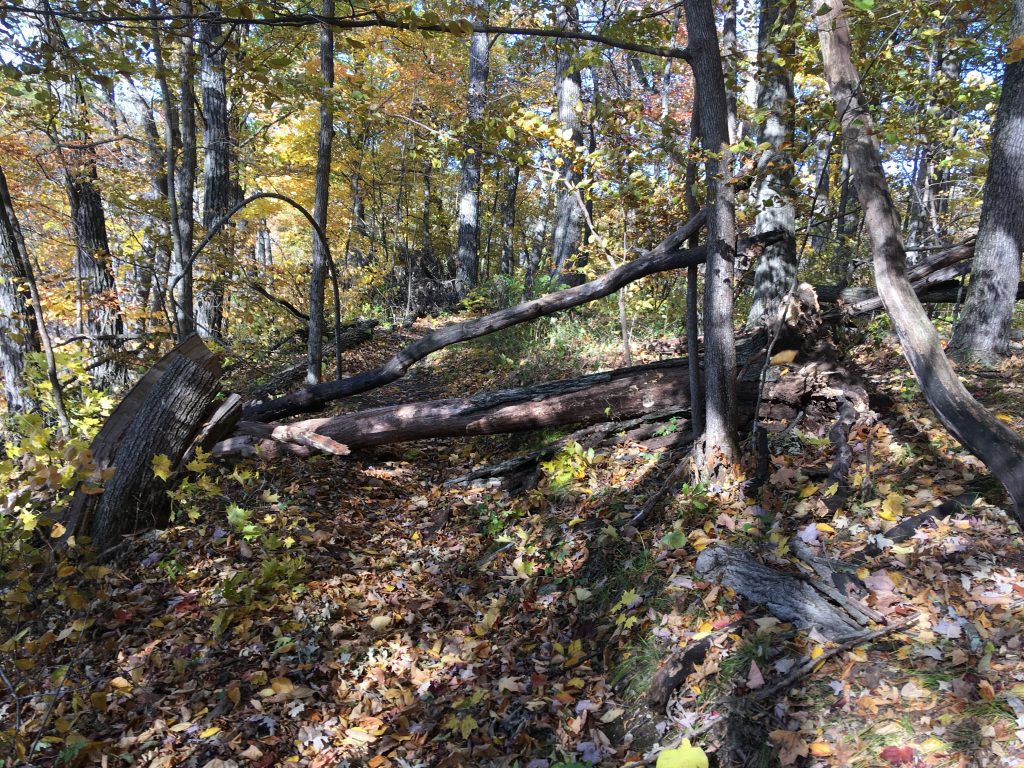
mountain biking greenbush tree blocks trail
I’m not going to be able to bunny hop this at Greenbush, 10/21/2022
mountain biking greenbush pond at far end of single track
The pond out at the far end of the Greenbush single track, 10/21/2022

Mountain Biking Power Measurement Accuracy For Cykelstrom

The best accuracy for this ride is highlighted in bold.

SensorsCrank Power Meter (Watts avg.)Cykelstrom (Watts avg.)Difference (Watts)Margin of Error (Watts)
External Speed and Cadence122.13146.6124.48+/- 2.76
GPS Speed and External Cadence122.13122.680.54+/- 3.00
External Speed Only123.41167.2243.81+/- 3.10
GPS Speed Only123.41141.5918.18+/- 3.38
Table created using Bland-Altman Analysis using a 4iiii Precision Pro single sided crank power meter as the standard with 95% confidence level.

Discussion Of Mountain Biking Greenbush Results

The most accurate results for this ride were when the internal GPS Speed data and an external cadence sensor were used. Cykelstrom provides the best accuracy and results when a cadence sensor is used when mountain biking. The need for a speed sensor is dependent on how much GPS satellite coverage is available. For cases when you are under heavy tree canopy an external speed sensor is recommended. For this ride, the leaves have fallen off of the trees and GPS coverage was excellent.

For information on how to connect a Bluetooth cadence sensor to Cykelstrom please visit Adding Bluetooth Sensors To Cykelstrom.

Strava Activity

Click on the map to visit this activity in Strava.

Elapsed Time Moving Time Distance Average Speed Max Speed Elevation Gain Calories Burned
01:28:02
hours
01:18:34
hours
9.40
mi.
7.18
mph
12.82
mph
914.37
ft.
905
kcal
All the leaves covering the rocks, boulders and roots made for an interesting ride. Next to no traction with Race King Tires on the leaves.

Follow Cykelstrom Test Rides On Strava

The Cykelstrom Bicycle Power Meter App Is Exclusively Available On Google Play

bicycle power meter app download button
Cykelstrom Bicycle Power Meter App Download
cykelstrom scan QR code
Scan to go to Cykelstrom on Google Play

Road And Gravel Biking Via The Wiouwash Trail – October 11th, 2022

Road and gravel biking video from Oshkosh to Hortonville, Wisconsin via the Wiouwash Trail presents the Cykelstrom Bicycle Power Meter App. I ride with Stacey part way on her commute to work and then split off to ride the Butte de Morts Bridge to the Wiouwash Trail round trip to Hortonville.

If you would like to see more Cykelstrom Bicycle Power Meter App videos, please visit @Cykelstrom on YouTube and remember to “Like” and “Subscribe” to our channel.

Trail Pic

road and gravel biking
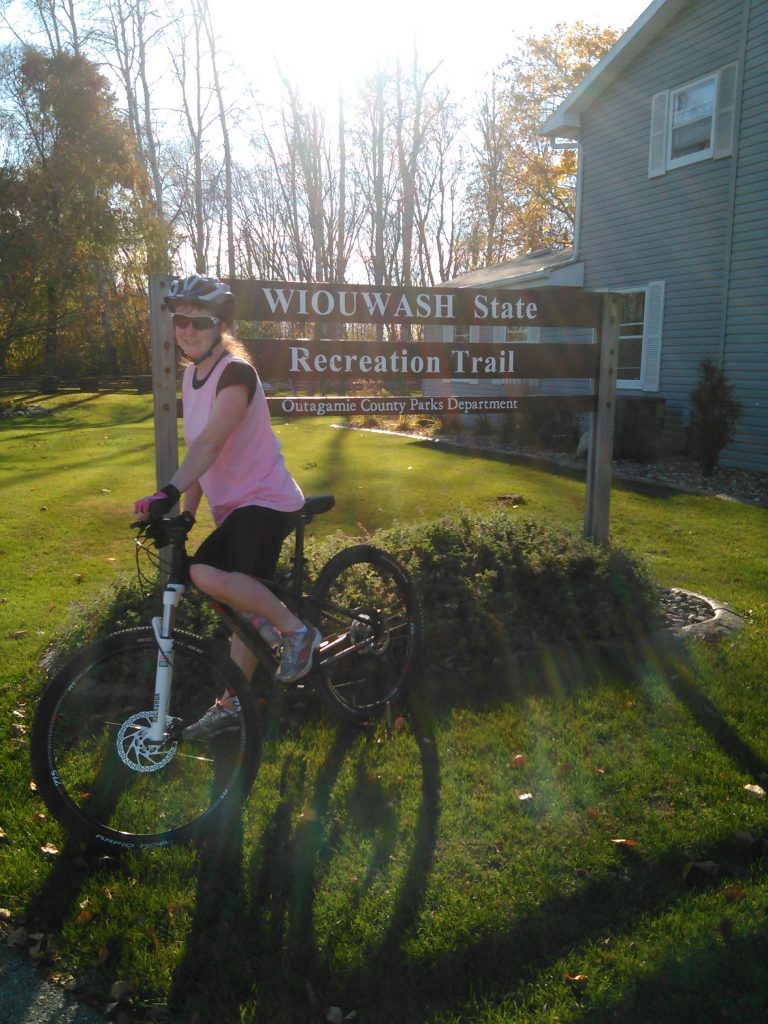
Stacey At The Wiouwash Trail Head in Hortonville, Wisconsin

Road and Gravel Biking App Accuracy For This Ride

The best accuracy is highlighted in bold.

SensorsCrank Power Meter (Watts avg.)Cykelstrom (Watts avg.)Difference (Watts)Margin of Error (Watts)
External Speed and Cadence127.69158.1930.51+/- 1.28
GPS Speed and External Cadence127.69150.6923.00+/- 1.22
External Speed Only129.28167.3038.02+/- 1.33
GPS Speed Only129.28158.6129.33+/- 1.27
Table created using Bland-Altman Analysis using a 4iiii Precision Pro dual sided crank power meter as the standard with 95% confidence level.

Road And Gravel Biking Ride’s Results

The most accurate results for this ride were when the internal GPS Speed data and an external cadence sensor were used. There was a difference of 23.00 +/- 1.22 watts between the app and the crank power meter. The app based on this information is within 18% of the power meter which given the roughness of a gravel trail may be acceptable to the recreational cyclist. The addition of an inexpensive cadence sensor helps make the Cykelstrom Bicycle Power Meter App more accurate.

For information on how to connect a Bluetooth cadence sensor to Cykelstrom please visit Adding Bluetooth Sensors To Cykelstrom.

Strava Activity

Click on the map to visit this activity in Strava. 

Elapsed Time Moving Time Distance Average Speed Max Speed Elevation Gain Calories Burned
03:54:10
hours
03:48:33
hours
52.37
mi.
13.75
mph
22.11
mph
527.56
ft.
2,593
kcal
Too nice of a day, indoor trainer no way!

Follow Cykelstrom Test Rides On Strava

The Cykelstrom Road and Gravel Biking App Is Exclusively Available On Google Play

bicycle power meter app download button
Cykelstrom Bicycle Power Meter App Download
cykelstrom scan QR code
Scan to go to Cykelstrom on Google Play

Gravel Biking The Wiouwash Trail – October 3rd, 2022

I gravel bike the Wiouwash Trail from the public parking area near Bare Bones Brewery in Oshkosh to Hortonville, Wisconsin round trip. The Cykelstrom Bicycle Power Meter App is presented on the video and added graphics are used to show how the app compares to a crank based power meter, a map, and a gauge which shows the grade of the trail.

Gravel Biking The Wiouwash Trail – October 3rd, 2022

If you would like to see more Cykelstrom Bicycle Power Meter App videos, please visit @Cykelstrom on YouTube and remember to “Like” and “Subscribe” to our channel.

Trail Pic

gravel biking, wiouwash trail, stacey
Stacey with her Trek Crockett gravel biking the Wiouwash Trail north of Larsen, Wisconsin

Gravel Biking The Wiouwash Trail Cykelstrom Accuracy

The best accuracy for this ride is highlighted in bold.

SensorsCrank Power Meter (Watts avg.)Cykelstrom (Watts avg.)Difference (Watts)Margin of Error (Watts)
External Speed and Cadence140.00130.70-9.30+/- 0.9532
GPS Speed and External Cadence140.00121.52-18.48+/- 0.9534
External Speed Only142.31140.32-1.99+/- 1.12
GPS Speed Only142.31127.98-14.32+/- 1.07
Table created using Bland-Altman Analysis using a 4iiii Precision Pro dual sided crank power meter as the standard with 95% confidence level.

The Gravel Bike For This Test Ride

I rode a Diamondback Haanjo Comp as a gravel bike for this ride equipped with a 4iiii Precision Pro dual sided power meter on a Shimano 105 11-speed group set. The cadence sensors were Wahoo Bluetooth cadence and speed sensors. Heart rate information was collected with a Polar H6 chest strap sensor. The smartphone was a MotorolaG6 running Android Oreo and Cykelstrom version 1.36. All of the power meter and sensor data and was collected, saved locally and automatically uploaded to Strava with the Cykelstrom Bicycle Power Meter App.

Discussion Of This Ride’s Results

I have highlighted in bold the results from “External Speed and Cadence” and “External Speed Only.” I leave it to you to decide which is more accurate. I think this points out one of the disadvantages of looking at averages when comparing two methods of measurement.

I would have a tendency to think that the data measured with cadence would be more accurate, however the data shows less of a difference between averages when no cadence information is considered when measuring the cyclists power.

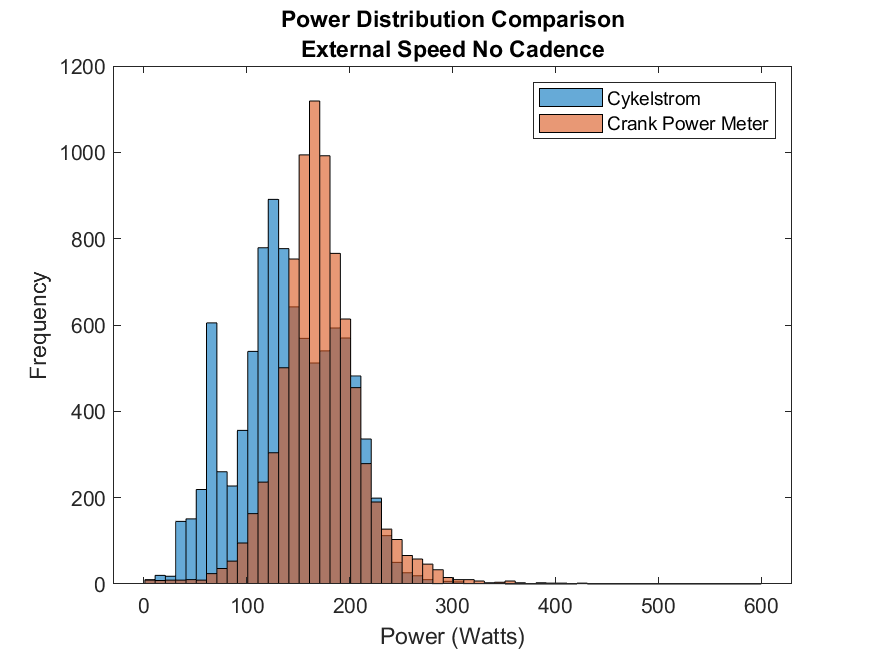
gravel bike power distribution with external speed and cadence sensors
Gravel Biking The Wiouwash Trail – October 3rd, 2022
gravel bike power distribution with only an external speed sensor
Gravel Biking The Wiouwash Trail – October 3rd, 2022

Looking at the shapes of the two distributions shows me two things. First, when considering cadence information the distributions appear to be more similar than when cadence information is ignored. Second, the Cykelstrom power distribution is multi-modal with a couple of peaks. I hypothesize that a wind shift during this particularly longer ride is represented in Cykelstrom’s calculated estimates of power.

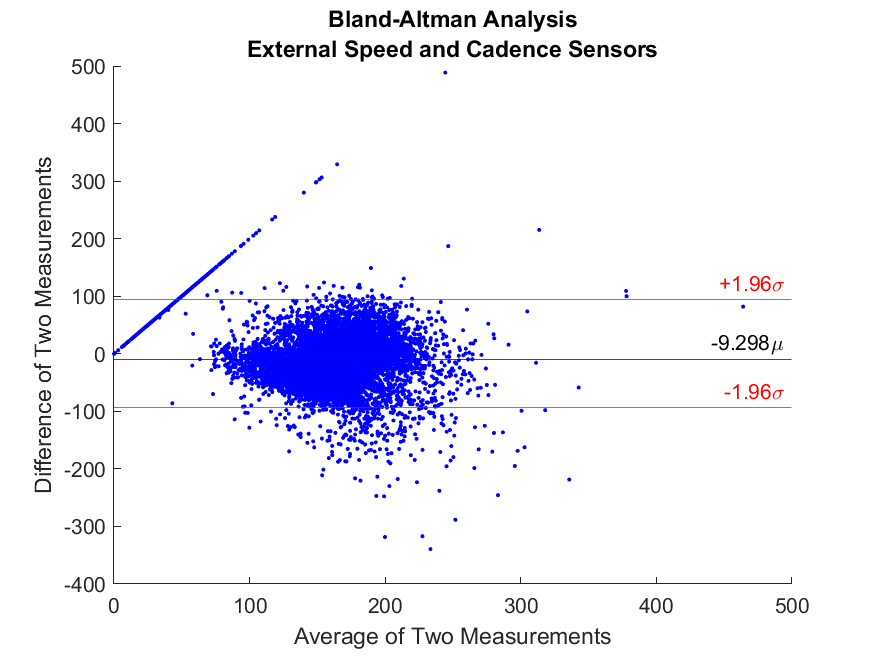
Bland-Altman Analysis

Gravel Biking The Wiouwash Trail – October 3rd, 2022

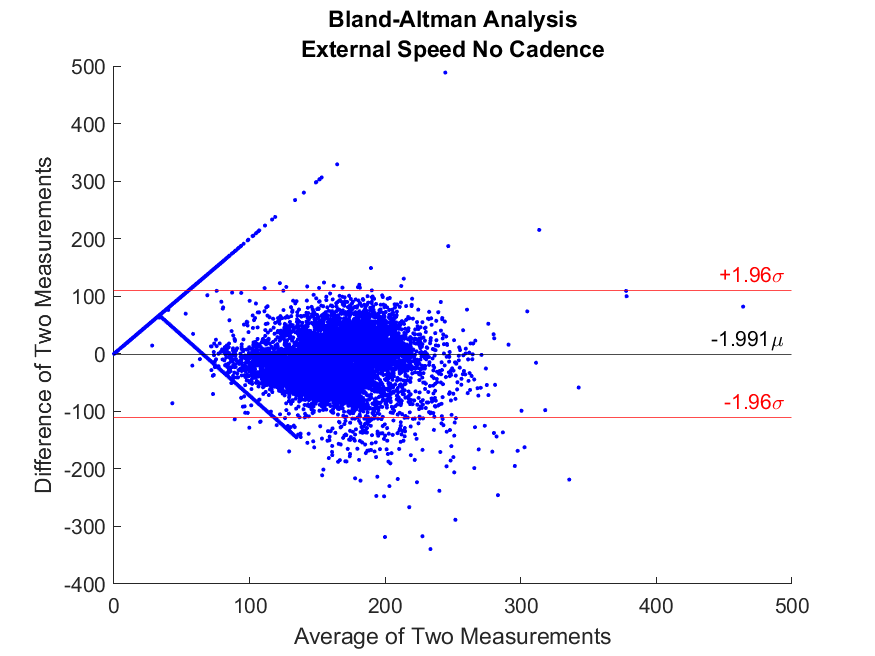
Other than the bias differences, these two data sets look very similar from this point of view.

I conclude that the Cykelstrom Bicycle Power Meter App provided particularly good power information to the cyclist when using a cadence senor. For information on how to set up a cadence sensor please see the article Adding Bluetooth Sensors To Cykelstrom.

Strava Activity

Click on the map to visit this activity in Strava.

Elapsed Time Moving Time Distance Average Speed Max Speed Elevation Gain Calories Burned
02:42:09
hours
02:25:38
hours
36.93
mi.
15.21
mph
19.56
mph
296.92
ft.
1,451
kcal
Madonna is very ridable music; the miles just disappeared.

Follow Cykelstrom Gravel Bike Test Rides on Strava

The Cykelstrom Gravel Bike Power Meter App Is Exclusively Available On Google Play

bicycle power meter app download button
Cykelstrom Bicycle Power Meter App Download
cykelstrom scan QR code
Scan to go to Cykelstrom on Google Play