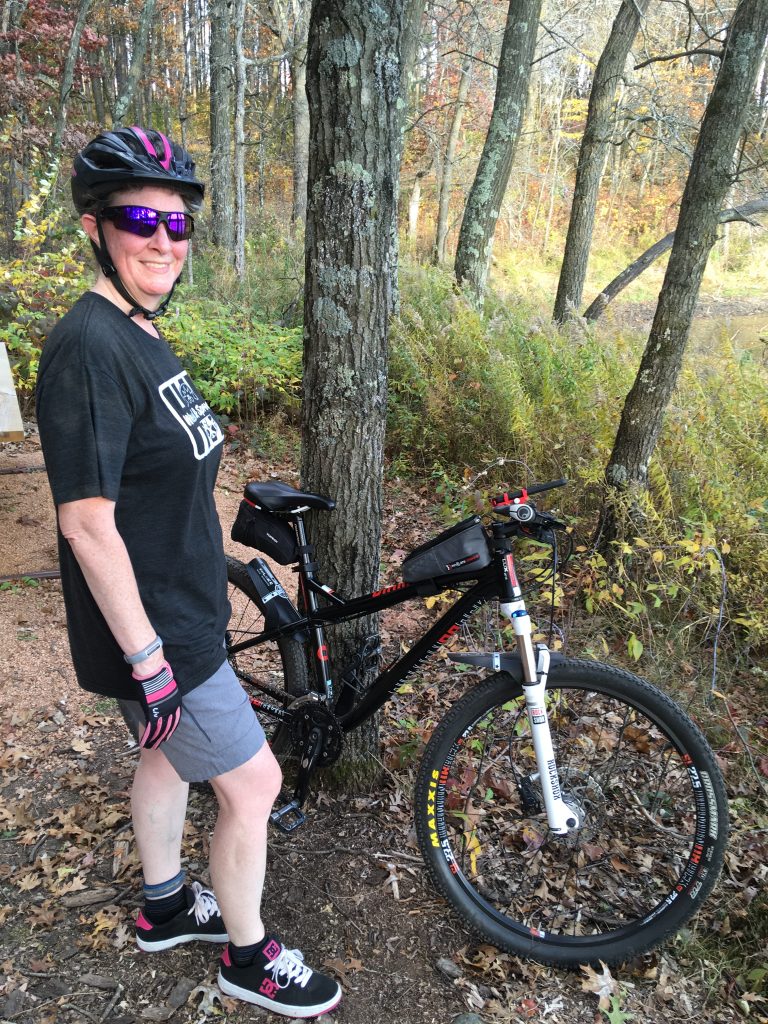
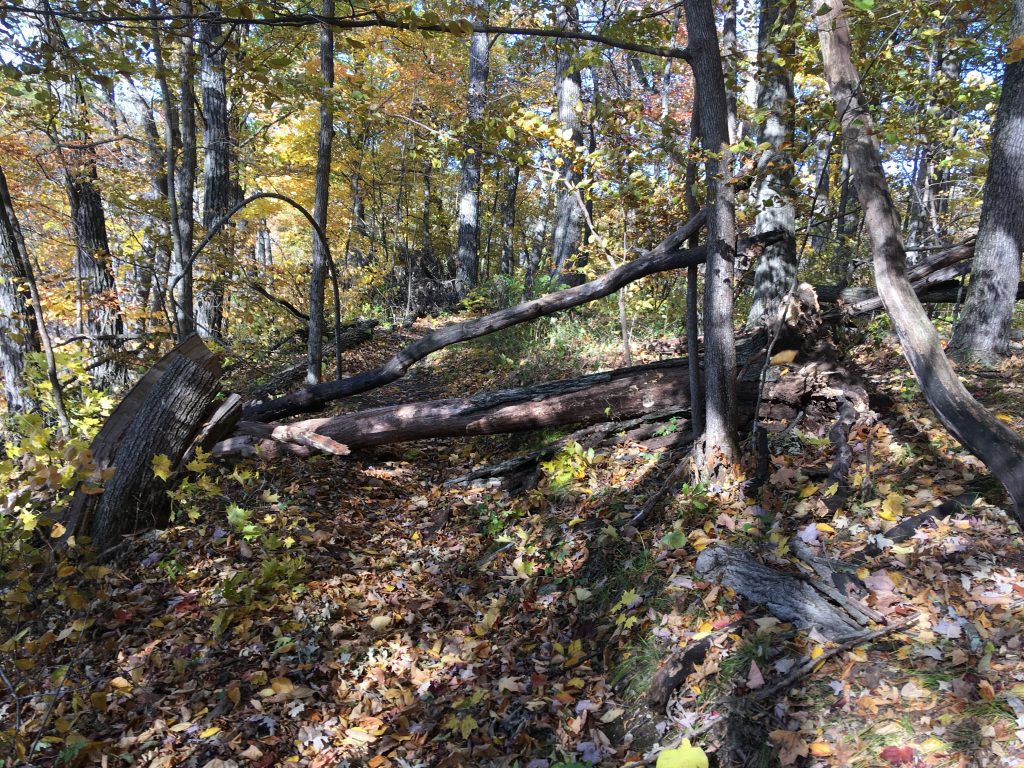
I ride Hartman Creek State Park mountain biking green, blue and black trails, possibly for the last time before snow. It was very difficult to see the trail in some places due to all the fallen leaves. I ride here enough that I could do it blind folded, but the leaves covering some of the roots and rocks made for some interesting moments.
If you would like to see more Cykelstrom Bicycle Power Meter App videos, please visit @Cykelstrom on YouTube and remember to “Like” and “Subscribe” to our channel.
The Mountain Bike For This Ride
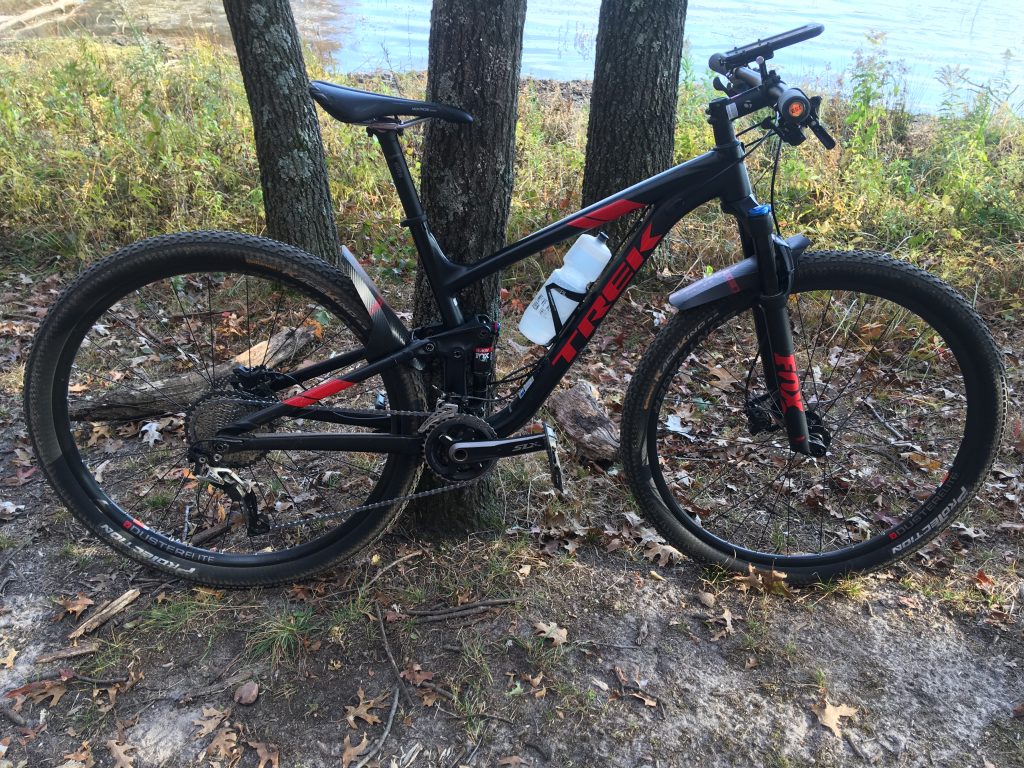
I rode a Trek Top Fuel 8 as a full suspension mountain bike for this ride equipped with a 4iiii Precision Pro left sided power meter on a Shimano SLX 11-speed group set. Cykelstrom collected cadence information from the power meter. Cykelstrom collected speed information using a Wahoo Bluetooth speed sensor. A Polar H7 chest strap sensor collected heart rate information. The smartphone was a MotorolaG6 running Android Oreo and Cykelstrom version 1.36. All of the power meter and sensor data was collected, saved locally, and automatically uploaded to Strava with the Cykelstrom Bicycle Power Meter App.
Mountain Biking App Accuracy For This Ride
The best accuracy is highlighted in bold.
| Sensors | Crank Power Meter (Watts avg.) | Cykelstrom (Watts avg.) | Difference (Watts) | Margin of Error (Watts) |
| External Speed and Cadence | 112.73 | 101.08 | -11.64 | +/- 2.19 |
| GPS Speed and External Cadence | 112.73 | 94.33 | -18.40 | +/- 2.25 |
| External Speed Only | 114.06 | 120.43 | 6.38 | +/- 2.62 |
| GPS Speed Only | 114.06 | 113.41 | -0.65 | +/- 2.71 |
Hartman Creek State Park Mountain Biking Results
The smallest bias but highest margin of error occurred when no additional sensors were used. The only sensors involved are internal to the Motorola G6 smartphone that was used during this test ride. The average difference between the power meter and the Cykelstrom App was only -0.65 +/- 2.71 watts. This represents a difference in the averages of only 0.5%. Getting good results like this are dependent on riding style in that I did not coast much during the ride. If you are the type of rider that pedals constantly, the need for a cadence sensor is minimal.
The smallest margin of error is represented when an external speed and cadence sensor were used. The average bias was -11.64 +/- 2.19 watts. If you are the type of rider who likes to coast a lot, then I recommend using a cadence sensor.
In all cases, for this ride, Cykelstrom was within 16.3% on average of the crank power meter. This is acceptable for most recreational mountain bike riders using a full suspension mountain bike on typical single track terrain and conditions.
If you would like to learn more about setting Cykelstrom up for a ride like this visit the article “Customizing Cykelstrom Through Settings.”
Strava Activity
Click on the map to visit this activity in Strava.
| Elapsed Time | Moving Time | Distance | Average Speed | Max Speed | Elevation Gain | Calories Burned |
|---|---|---|---|---|---|---|
|
01:23:02
hours
|
01:19:39
hours
|
10.50
mi.
|
7.91
mph
|
14.50
mph
|
558.73
ft.
|
653
kcal
|
Follow Cykelstrom Test Rides on Strava
The Cykelstrom Mountain Bike Power Meter App Is Available Exclusively On Google Play