Bicycle Computer – Cykelstrom Bicycle Power Meter App – West of Oshkosh, Wisconsin – June 20th, 2022

Cykelstrom is being demonstrated as a bicycle computer by displaying cycling performance information during this test ride.

Accuracy For This Ride

The best accuracy for this ride is highlighted in bold.

SensorsCrank Power Meter
(Watts avg.)
Cykelstrom (Watts avg.)Difference (Watts)Margin of Error (Watts)
GPS Speed and External Cadence132.69154.1021.42+/- 1.39
GPS Speed Only132.21164.0830.87+/- 1.56
Table created using Bland-Altman Analysis using a 4iiii Precision Pro dual sided crank power meter as the standard with 95% confidence level.

Discussion Of This Ride’s Results

The accuracy of this ride was not ideal, relative to the results of other similar rides. I suspect that I did not not calibrate the crank power meter correctly or I used the wrong side of the dual sided power meter for power information. This highlights the importance of selecting the correct sensor when collecting data. In my case, the dual sided power meter sends the correct power data through the left sensor, however you can connect to the right side power sensor and get a power reading, however that reading is for the right side only. If you are using a dual sided power meter, make sure you connect to the side that reports the combined power total. This is usually the left sensor side. If you are using a single sided power sensor this is not an issue.

Bicycle Computer Functions

I designed Cykelstrom to be a simple bicycle computer in addition to its ability to estimate the cyclists power. Cykelstrom displays and records the cyclists speed, heart rate, cadence, distance traveled, heading and many others. To learn how to use these functions and more see Using Cykelstrom On Your Ride in the Quick Start Guide.

Strava Activity

Click on the map to visit this activity in Strava. Feel free to follow me on Strava.

Elapsed Time Moving Time Distance Average Speed Max Speed Elevation Gain Calories Burned
01:44:50
hours
01:44:03
hours
24.70
mi.
14.24
mph
22.51
mph
437.34
ft.
1,151
kcal
Super hot day with temperatures in the mid 90's

Follow Me On Strava

The Cykelstrom Bicycle Computer App Is Only Available On Google Play

bicycle power meter app download button
Cykelstrom Bicycle Power Meter App Download
cykelstrom scan QR code
Scan to go to Cykelstrom on Google Play

Cykelstrom Bicycle Power Meter App – Short Ride West of Oshkosh, Wisconsin – June 15th, 2022

Stacey and I go on a short ride west of Oshkosh, Wisconsin on this very hot morning. This video shows the Cykelstrom Bicycle Power Meter App and detailed information of where the cyclist’s power goes. Calculated power estimates are shown for wind, up/down hill and rolling resistance power components.

Accuracy For This Ride

The best accuracy for this ride is highlighted in bold.

SensorsCrank Power Meter
(Watts avg.)
Cykelstrom
(Watts avg.)
Difference
(Watts)
Margin of Error
(Watts)
External Speed and Cadence89.56106.3016.74+/- 1.74
GPS Speed and External Cadence89.56103.7514.19+/- 1.69
External Speed Only89.39129.3539.96+/- 2.30
GPS Speed Only89.39126.0836.70+/- 2.24
Table created using Bland-Altman Analysis using a 4iiii Precision Pro dual sided crank power meter as the standard with 95% confidence level.

Discussion Of Bicycle Power Meter App Ride’s Results

The best accuracy, in bold, is when GPS Speed and an external cadence sensor was used. I would also like to point out that when only and external speed sensor or GPS speed was used in this ride, the accuracy was not as good due to a lot of coasting. The addition of the cadence sensor really helps out in this situation. You can observe on other rides where there is not a lot of coasting the that the GPS speed or speed sensor only results are better. For best accuracy, I recommend using an external cadence sensor. Cadence sensors are very inexpensive relative to purchasing a crank power meter. If you would like to learn how to add a cadence sensor please visit Adding Bluetooth Sensors to Cykelstrom.

Strava Activity

Click on the map to visit this activity in Strava. Feel free to follow me on Strava.

Elapsed Time Moving Time Distance Average Speed Max Speed Elevation Gain Calories Burned
01:02:44
hours
01:01:44
hours
13.83
mi.
13.44
mph
23.19
mph
276.90
ft.
544
kcal

Follow Me On Strava

The Cykelstrom Bicycle Power Meter App Is Only Available on Google Play

bicycle power meter app download button
Cykelstrom Bicycle Power Meter App Download
cykelstrom scan QR code
Scan to go to Cykelstrom on Google Play

Bicycle Computer App – Bicycle Ride West of Oshkosh, Wisconsin June 13th, 2022

This is my regular bicycle ride to test and validate the Cykelstrom Bicycle Power Meter App. Cykelstrom is a bicycle computer app for Android smartphones that displays and records performance data for the cyclist. Cykelstrom calculates an estimate of power expenditure of the cyclist using the sensors in the smartphone and/or external sensors. If you would like to learn more about how to use Cykelstrom please visit Using Cykelstrom On Your Ride.

Accuracy Of The Bicycle Computer App For This Ride

The best accuracy is highlighted in bold.

SensorsCrank Power Meter
(Watts avg.)
Cykelstrom
(Watts avg.)
Difference
(Watts)
Margin of Error
(Watts)
External Speed and Cadence146.24150.864.62+/- 1.38
GPS Speed and External Cadence146.24146.880.64+/- 1.32
External Speed Only146.56155.589.02+/- 1.49
GPS Speed Only146.56151.424.86+/- 1.41
Table created using Bland-Altman Analysis using a 4iiii Precision Pro dual sided crank power meter as the standard with a 95% confidence level.

Strava Activity

Click on the map below to see this ride activity in Strava. Feel free to follow me on the Strava App.

Elapsed Time Moving Time Distance Average Speed Max Speed Elevation Gain Calories Burned
01:40:12
hours
01:37:18
hours
25.37
mi.
15.64
mph
25.66
mph
436.35
ft.
1,047
kcal

Follow Me On Strava

The Cykelstrom Bicycle Computer App Is Only Available on Google Play

bicycle power meter app download button
Cykelstrom Bicycle Power Meter App Download
cykelstrom scan QR code
Scan to go to Cykelstrom on Google Play

Cykelstrom Bicycle Power Meter App – Bicycle Ride West of Oshkosh, Wisconsin – June 12th, 2022

This is my regular daily ride to demonstrate and validate the Cykelstrom Bicycle Power Meter App. In this ride I get detoured about 45 minutes in to the video due to a manure trailer that overturned in to the ditch. I stop and watch the farmers attempting to get the trailer out of the ditch for a little while before I decide to backtrack and detour around the country block.

Cykelstrom Accuracy For This Ride

SensorsCrank Power Meter
(Watts avg.)
Cykelstrom
(Watts avg.)
Difference
(Watts)
Margin of Error
(Watts)
Speed, Cadence145.22137.54-7.68+/- 1.21
GPS Speed, Cadence145.22134.03-11.19+/- 1.16
Speed145.72143.23-2.49+/- 1.36
GPS Speed145.72139.64-6.08+/- 1.31
Table created using Bland-Altman Analysis using a 4iiii Precision Pro dual sided crank power meter as the standard with a 95% confidence level.

Strava Activity

Click on the map to go to this Strava activity. Feel free to follow me on Strava.

Elapsed Time Moving Time Distance Average Speed Max Speed Elevation Gain Calories Burned
01:59:00
hours
01:47:23
hours
27.64
mi.
15.45
mph
24.76
mph
519.03
ft.
1,143
kcal
Manure trailer fell in ditch so I had to backtrack and detour.

Follow Me On Strava

Cykelstrom Bicycle Power Meter App – Bicycle Ride West of Oshkosh, Wisconsin – June 10th, 2022

This is my regular daily ride to demonstrate and validate the Cykelstrom Bicycle Power Meter App. I like to observe changes that I make to improve accuracy and user experience. I am always looking to improve and if you have any feedback, please feel free to share in the comments below.

Cykelstrom Power Meter App Accuracy For This Ride

SensorsCrank Power Meter
(Watts avg.)
Cykelstrom
(Watts avg.)
Difference
(Watts)
Margin of Error
(Watts)
Speed, Cadence142.15160.89+18.74+/- 1.61
GPS Speed, Cadence142.15156.92+14.77+/- 1.56
Speed142.78168.25+25.47+/- 1.76
GPS Speed142.78163.83+21.05+/- 1.71
Table created using Bland-Altman Analysis using a 4iiii Precision Pro dual sided crank power meter as the standard with a 95% confidence level.

Discussion Of This Ride’s Results

The best accuracy for this ride is highlighted bold in the table above. The best accuracy was with the addition of a cadence sensor. To learn how to add a Bluetooth compatible cadence sensor to please visit Adding Bluetooth Sensors to Cykelstrom.

The results of this ride were automatically uploaded to Strava, to learn how to connect your Strava account for automatic uploads of your ride data please visit Upload Your Ride Data to Strava.

As the developer of Cykelstrom, I am always interested your suggestions and questions, feel free to contact me at developer@cykelstrom.com

Strava Activity

Click on the map to go to this Strava activity. Feel free to follow me on Strava.

Elapsed Time Moving Time Distance Average Speed Max Speed Elevation Gain Calories Burned
01:37:12
hours
01:36:19
hours
25.38
mi.
15.81
mph
23.60
mph
437.01
ft.
1,099
kcal

Follow Cykelstrom Test Rides on Strava

The Cykelstrom Bicycle Power Meter App Is Only Available on Google Play

bicycle power meter app download button
Cykelstrom Bicycle Power Meter App Download
cykelstrom scan QR code
Scan to go to Cykelstrom on Google Play

Bicycle Ride West Of Oshkosh, Wisconsin Using the Cykelstrom Power Meter App – June 9th, 2022

Cykelstrom Accuracy For This Ride

SensorsCrank Power Meter
(Watts avg.)
Cykelstrom
(Watts avg.)
Difference
(Watts)
Margin of Error
(Watts)
Speed, Cadence140.81149.01+8.19+/- 1.54
GPS Speed, Cadence140.81145.82+5.01+/- 1.45
Speed141.60156.40+14.80+/- 1.75
GPS Speed141.60152.84+11.25+/- 1.63
Table created using Bland-Altman Analysis using a 4iiii Precision Pro dual sided crank power meter as the standard with a 95% confidence level.

Strava Activity

Click on the map to go to this Strava activity. Feel free to follow me on Strava.

Elapsed Time Moving Time Distance Average Speed Max Speed Elevation Gain Calories Burned
01:44:11
hours
01:39:18
hours
25.36
mi.
15.32
mph
22.89
mph
437.01
ft.
1,096
kcal
Regular validation ride for the Cykelstrom Bicycle Power Meter App

Short Bicycle Ride South and West of Oshkosh, Wisconsin with Stacey – June 7th, 2022

Riding in the Oshkosh, Wisconsin Area South and West

Cykelstrom Accuracy For This Ride

SensorsCrank Power Meter
(Watts avg.)
Cykelstrom
(Watts avg.)
Difference
(Watts)
Margin of Error
(Watts)
Speed, Cadence88.6197.228.61+/- 1.61
GPS Speed, Cadence88.6194.986.37+/- 1.56
Speed90.43111.0420.61+/- 1.94
GPS Speed90.43108.3717.94+/- 1.88
Table created using Bland-Altman Analysis using a 4iiii Precision Pro dual sided crank power meter as the standard with a 95% confidence level.

Strava Activity

Click on map to see an analysis of this ride that was recorded using the Cykelstrom Bicycle Power Meter App and automatically uploaded to Strava. Feel free to follow me on Strava.

Elapsed Time Moving Time Distance Average Speed Max Speed Elevation Gain Calories Burned
01:02:38
hours
01:02:38
hours
13.80
mi.
13.22
mph
22.30
mph
277.23
ft.
470
kcal

Hartman Creek State Park – Green, Blue and Black Trails Testing Handlebar Mounted Camera – April 28th, 2022

In this video, I am testing the mounting location of a Drift GhostX video camera on the handlebars of my Trek Top Fuel 8 full suspension mountain bike.

Testing a handlebar mounted camera on a Top Fuel 8 at Hartman Creek State Park
Elapsed Time Moving Time Distance Average Speed Max Speed Elevation Gain Calories Burned
01:11:52
hours
01:08:44
hours
10.55
mi.
9.21
mph
16.86
mph
559.71
ft.
1,440
kcal

Riding Hartman Creek State Park And Getting Caught In The Rain – May 19th, 2022

Comparing the Cykelstrom Bicycle Power Meter App to a single sided crank power meter
Elapsed Time Moving Time Distance Average Speed Max Speed Elevation Gain Calories Burned
01:11:16
hours
01:08:34
hours
10.47
mi.
9.16
mph
15.06
mph
563.65
ft.
1,245
kcal

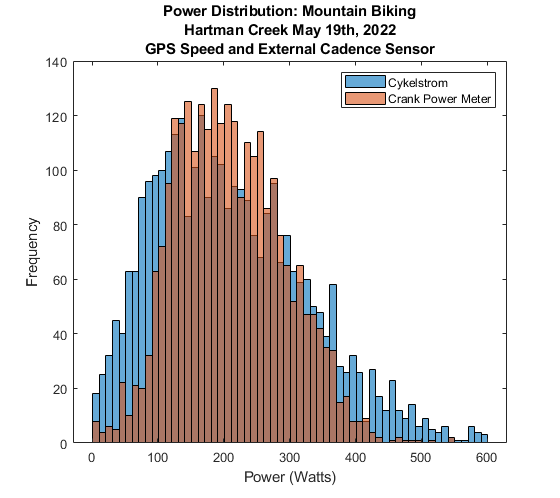
GPS Speed with External Cadence Sensor

CykelstromCrank Power MeterDifference (%)
Average Power156.15132.59+ 17.76
Correlation.56471
Standard Deviation141.65120.29
Cykelstrom Bicycle Power Meter App using GPS speed and external cadence sensor

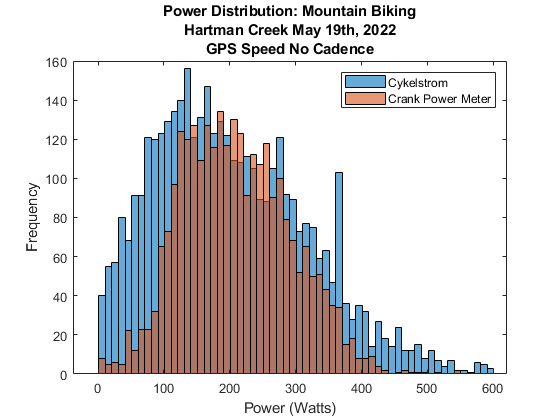
GPS Speed and No External Sensors

CykelstromCrank Power MeterDifference (%)
Average Power194.24132.59+ 46.50
Correlation.30651
Standard Deviation128.94120.29
Cykelstrom Bicycle Power Meter App using GPS speed and no external sensors

Mountain Biking Hartman Creek State Park Waupaca, Wisconsin – May 17th, 2022

Comparing the Cykelstrom Bicycle Power Meter App to a single sided crank power meter
Elapsed Time Moving Time Distance Average Speed Max Speed Elevation Gain Calories Burned
01:14:28
hours
01:12:19
hours
8.08
mi.
6.70
mph
16.40
mph
540.03
ft.
940
kcal
Nice day to ride in the woods at Hartman Creek State Park near Waupaca, Wisconsin. This was a test ride to compare the Cykelstrom Bicycle Power Meter App to a crank based power meter using only a cadence sensor. Speed information came from the GPS of the smartphone. The power meter used as the standard comparison was a 4iiii Precision Pro left sided Shimano XT crank.

Mountain Biking with the Cykelstrom Bicycle Power Meter App

Mountain biking and getting good power measurement data is certainly a challenge. The technology that Cykelstrom depends on is better suited to smooth steady and open conditions, like road cycling. The aggressive characteristics of mountain biking introduce a significant amount of noise to the signals Cykelstrom uses to calculate power. In addition, GPS signals can be difficult to obtain under heavy foliage or obstructions to the sky. Even though it is challenging, Cykelstrom appears to give acceptable data information, typically +/- 25% on average, but errors can be larger depending on conditions.

Remember, that when riding in a heavily sheltered area from the wind that it may be best to turn off the weather data and set wind speed to zero.

I am still studying the differences between full suspension and hardtail mountain bikes and as the data comes in I will share them in my posts. So check back often and if you wish to participate in my study, please contact me, developer@cykelstrom.com

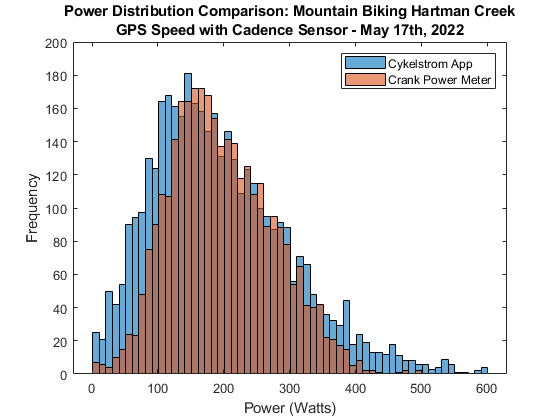
GPS Speed with External Cadence Sensor

CykelstromCrank Power MeterDifference (%)
Average Power177.20142.89+ 24.08
Correlation.36671
Standard Deviation119.86112.23
Cykelstrom Bicycle Power Meter App using GPS speed and external cadence sensor

When using Cykelstrom with GPS speed and an external cadence sensor, you can see that the data distribution is very similar to the crank power meter. This appears to be the best configuration and I recommend using an external cadence sensor.

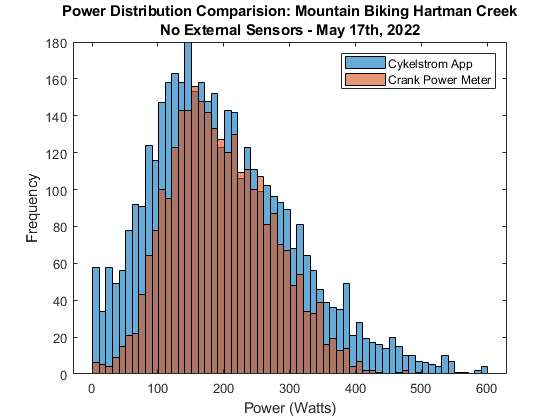
GPS Speed No External Sensors

CykelstromCrank Power MeterDifference (%)
Average Power182.59142.89+ 27.78
Correlation.33551
Standard Deviation118.68112.23
Cykelstrom Bicycle Power Meter App using GPS speed and no external sensors

When no external sensors are used, the shape of the data is similar to the crank power meter, however there is a lot of coasting and impulse like pedaling that occurs in mountain biking and Cykelstrom has a tendency to overestimate power in these circumstances.

Conclusion

Mountain biking conditions present challenges to smartphone applications that calculate power estimates, but if your are willing to accept the relative error they still provide useful information which further enhances your riding experience. For best results, use an external cadence sensor and if most of your riding is sheltered from the wind, turn off the weather data and set wind speed to zero.

As always, let me know your thoughts.

Happy riding,

Chuck